
- Title
-
Loss-of-Function Models of the Metabotropic Glutamate Receptor Genes Grm8a and Grm8b Display Distinct Behavioral Phenotypes in Zebrafish Larvae (Danio rerio)
- Authors
- Lüffe, T.M., Bauer, M., Gioga, Z., Özbay, D., Romanos, M., Lillesaar, C., Drepper, C.
- Source
- Full text @ Front. Mol. Neurosci.

Pattern of grm8a and grm8b expression in the developing zebrafish revealed by whole-mount RNA in situ hybridization. (A) Grm8a expression at 24, 36, and 48 hpf in the developing zebrafish. Lateral (top) and dorsal (bottom) overviews indicate expression as early as 24 hpf in the central nervous system. (B) Grm8b expression at 24, 36, and 48 hpf in the developing zebrafish. Lateral (top) and dorsal (bottom) overviews indicate prominent expression as early as 24 hpf in the central nervous system. Details on the individual expression patterns are described in the main text. Arrowheads indicate transcript labeling in individual cell cluster of the medulla oblongata (MO). All images are oriented with anterior to the left. Abbreviations are listed in Table 1. Scale bar is 100 μm. |
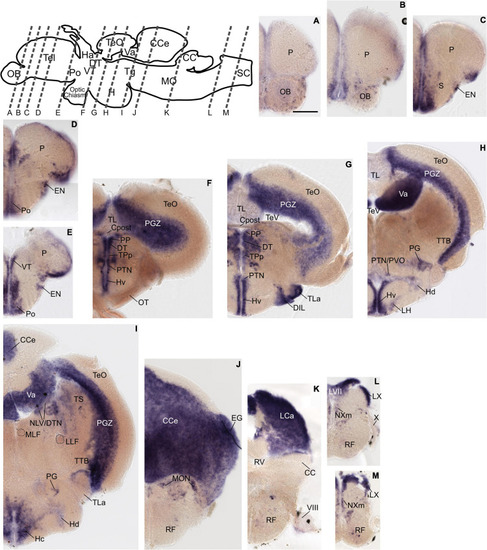

Grm8b expression pattern in adult zebrafish brain labeled by RNA in situ hybridization. (A–L) Grm8b transcript labeling by RNA in situ hybridization on cross-sections of an adult zebrafish brain. Images are arranged from anterior to posterior as indicated by the scheme at the top. Details on grm8b expression pattern are described in the main text. Anatomical abbreviations are listed in Table 1. Scale bar is 200 μm. EXPRESSION / LABELING:
|
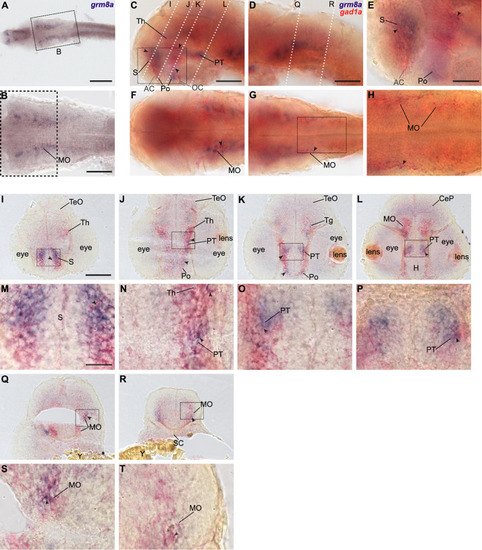
Grm8a is partly expressed in gad1a positive neurons in the developing zebrafish brain. (A) Whole-mount RNA in situ hybridization of grm8a expression at 36 hpf. (B) Magnified picture of the region boxed in (A). Scale bar, 200 μm (overview) and 100 μm (magnification). (C–T) Double labeling of grm8a (blue) and gad1a (red) expression in 36 hpf old embryos using two-color RNA in situ hybridization. Lateral (C,D) and dorsal (F,G) overview of embryonic CNS with anterior to the left. (E,H) Magnifications of boxed areas in (C,G). Dashed lines in (C,D) indicate cutting sites for cross sections shown in (I–R). (M–P,S,T) Magnifications of boxed areas in (I–L,Q,R), respectively. Arrowheads indicate sites of co-localization. Abbreviations are listed in Table 1. Scale bars: 100 μm (overview), 50 μm (magnified images). EXPRESSION / LABELING:
|

Generation of grm8a and grm8b knock-out lines using CRISPR/Cas9. (A) Grm8a exon-intron structure (top) with coding (gray) and non-coding exons (white). The sgRNA (pink) targeting grm8a exon 4 and the primer binding sites for genotyping PCR are displayed. The CRISPR/Cas9-induced strand break (black arrowheads) caused a 17 bp deletion represented by a smaller PCR product (pink asterisk) in grm8a± and grm8a–/– animals (bottom). The third band of ∼220 bp corresponds to a heterodimer of wildtype and mutated PCR product (black asterisks). (B) The predicted amino acid sequence of the wildtype (top) and mutated allele (bottom) show that the frameshifted sequence (black box) is interrupted by a premature stop codon (pink asterisk) in the ligand binding domain. (C) Grm8b exon-intron structure (top) with coding (gray) and non-coding exons (white). The sgRNA (pink) targeting grm8b exon 2 and the primer binding sites for genotyping are indicated. The CRISPR/Cas9-induced strand break (black arrowheads) caused a 13 bp deletion represented by a smaller PCR product (pink asterisk) in grm8b± and grm8b–/– animals (bottom). The third band of ∼250 bp corresponds to a heterodimer of wildtype and mutated PCR product (black asterisks). (D) The predicted amino acid sequence of the wildtype (top) and mutated allele (bottom) shows that the frameshifted sequence (black box) is interrupted by a premature stop codon (pink asterisk) in the N-terminal domain. (E) Dorsal (top) and ventral (bottom) views of 5 dpf old grm8a+/+, grm8a± and grm8a–/– zebrafish. Anterior is to the left. (F) Dorsal (top) and ventral (bottom) views of 5 dpf old grm8b+/+, grm8b± and grm8b–/– zebrafish. Scale bar, 1 mm. PHENOTYPE:
|

Behavioral characterization of grm8a and grm8b larvae. (A) Locomotor activity of grm8a (left panel) and grm8b mutant animals (right panel) were analyzed for mean velocity (top left) in low or high activity, or combined (total), total distance swum (top right), duration (bottom left) and events (bottom right) of inactivity, low and high activity. Raw data was standardized using z-score transformation. *P < 0.05, **P < 0.01. (B) Example traces of grm8b+/+, grm8b+/–, and grm8b–/– animals analyzed for thigmotaxis behavior. Note the reduced movement of mutant animals in the inner zone. Green represents slow, red fast movement. (C) Analysis of thigmotaxis behavior in grm8a (left panel) and grm8b (right panel) mutant animals. Time spent in the outer ring was analyzed for all genotypes and raw data standardized using z-score transformation. *P < 0.05. PHENOTYPE:
|

ZFIN is incorporating published figure images and captions as part of an ongoing project. Figures from some publications have not yet been curated, or are not available for display because of copyright restrictions. EXPRESSION / LABELING:
|
|
ZFIN is incorporating published figure images and captions as part of an ongoing project. Figures from some publications have not yet been curated, or are not available for display because of copyright restrictions. EXPRESSION / LABELING:
|
|
ZFIN is incorporating published figure images and captions as part of an ongoing project. Figures from some publications have not yet been curated, or are not available for display because of copyright restrictions. |