
- Title
-
NGLY1 Deficiency Zebrafish Model Manifests Abnormalities of the Nervous and Musculoskeletal Systems
- Authors
- Mesika, A., Nadav, G., Shochat, C., Kalfon, L., Jackson, K., Khalaileh, A., Karasik, D., Falik-Zaccai, T.C.
- Source
- Full text @ Front Cell Dev Biol
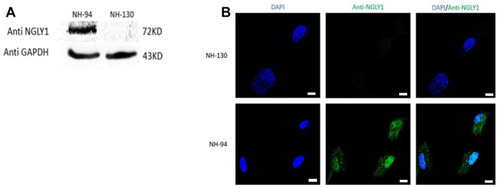
NGLY1 protein levels are reduced in patients with NGLY1 deficiency. (A) WB analysis of NGLY1 protein with an antibody against human NGLY1, GAPDH was used as a loading control. (B) Immunofluorescence staining of NGLY1 protein level. Blue: DAPI, green: anti-NGLY1. NH-94 = healthy control; NH-130 = Patient. Scale bars- 20 µm. |
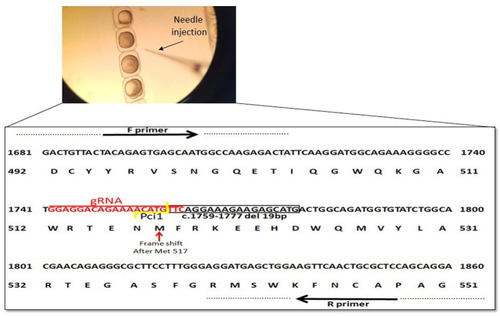
Schematic representation of ngly1 gene targeting in zebrafish. CRISPR/Cas9 gRNA in exon9 (in red), deletion of 19bp (c.1759–1777) is marked by black box and frameshift starting point is indicated by red arrow. Primers used for PCR amplification are marked. |
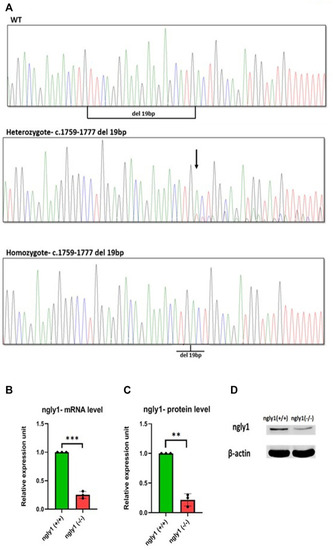
Mutation characterization in zebrafish- (A) Genotype screening in DNA extracted from zebrafish, Representative electrophoregrams indicating the sequences of WT, heterozygote and homozygote. (B) qPCR analysis quantification of ngly1 mRNA levels. t-test (ngly1 (+/+) n = 3, ngly1 (−/−) n = 3, ***p < 0.001). (C) WB analysis quantification of ngly1 protein levels. t-test (ngly1 (+/+) n = 3, ngly1 (−/−) n = 3, **p < 0.01). (D) WB analysis with an antibody against ZF ngly1; β-actin was used as a loading control. |

ngly1 (−/−) larvae displayed loss of axon fibers in the PNS compared to ngly1 (+/+). (A) Dorsal view and (B) ventral view (C) Brain (D) Spinal cord of 6dpf larvae (WT) identified by in situ hybridization analysis-X4, X20, confocal Nikon eclipse, n = 10. (E) Brain (F) Spinal cord of Tg (HUC:gal4 uas:mem YFP-mito CFP)- X20, confocal Nikon eclipse, n = 5. (G) ngly1 (+/+) control and (H) ngly1 (−/−) mutant groups at 6dpf. Sc = spinal cord, Pn = Peripheral nerves, white arrow represents the loss of axon fibers in PNS. X4, confocal Nikon eclipse. (I) Quantification of fluorescence by neurons, t-test (n = 8 in each group ***p < 0.001). Scale bars: black- 50 µm, white- 20 µm. |
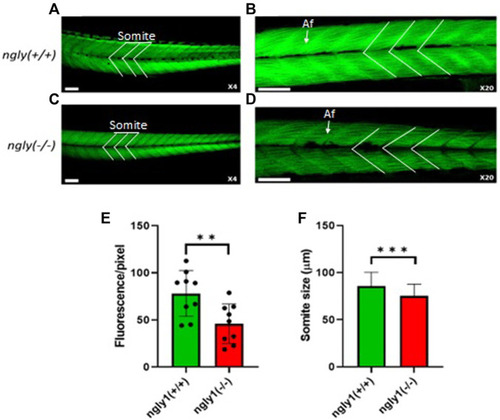
Muscle structure morphology. Representation of ngly1 (+/+) (A,B) and ngly1 (−/−) (C,D) Phalloidin staining for actin (A-X4 and B-X20). Af = Actin filaments. (E) Quantification analysis of the Phalloidin fluorescence. t-test (n = 9 in each group, **p < 0.01). (F) Mean size of somite (µm). t-test (ngly1 (+/+), n = 65. ngly1 (−/−), n = 79, ***p < 0.001). Scale bars—50 µm. PHENOTYPE:
|
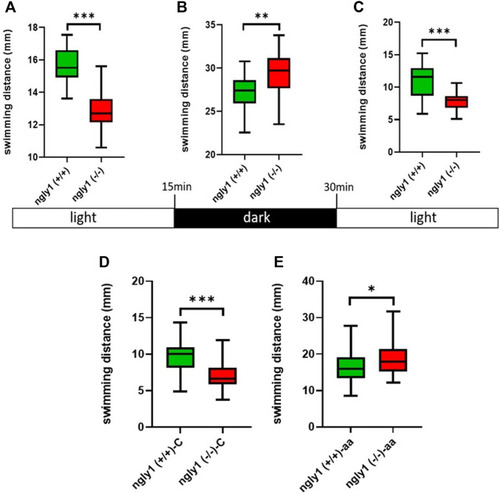
Locomotion analysis. (A–C) Quantification of swimming distance of ngly1 (+/+) and ngly1 (−/−) larvae for 5 min at various consecutive light conditions: light-dark-light. Each experiment was repeated 3 times, n = 91, t-test, **p < 0.01, ***p < 0.001. (D) Quantification of swimming distance in larvae (6dpf) at normal conditions. C: control, t-test (n = 12 in each group, ***p < 0.001). (E) Quantification of swimming distance after acetic acid (pH = 3.8) treatment-ngly1 (+/+) compared to ngly1 (−/−) from one independent experiment. aa: acetic acid, t-test (n = 36 in each group, *p < 0.05). PHENOTYPE:
|