
Image
|
Figure Caption
Fig. 6
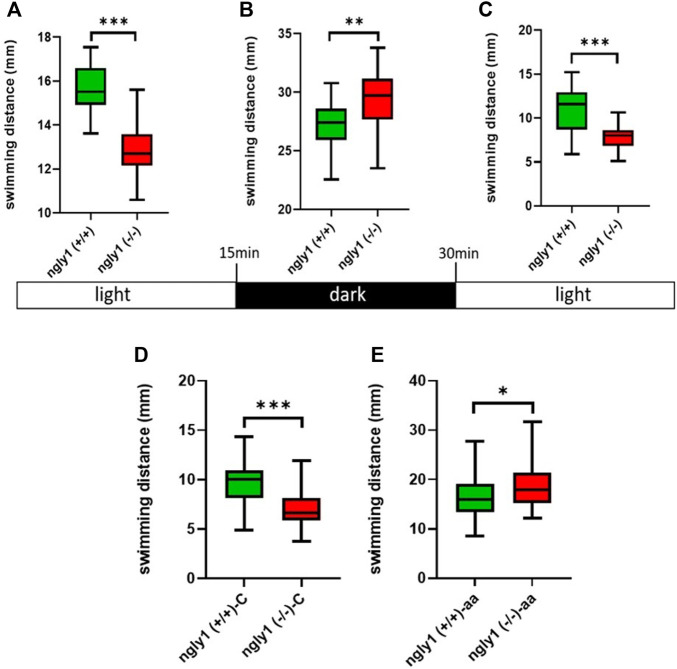
Locomotion analysis. (A–C) Quantification of swimming distance of ngly1 (+/+) and ngly1 (−/−) larvae for 5 min at various consecutive light conditions: light-dark-light. Each experiment was repeated 3 times, n = 91, t-test, **p < 0.01, ***p < 0.001. (D) Quantification of swimming distance in larvae (6dpf) at normal conditions. C: control, t-test (n = 12 in each group, ***p < 0.001). (E) Quantification of swimming distance after acetic acid (pH = 3.8) treatment-ngly1 (+/+) compared to ngly1 (−/−) from one independent experiment. aa: acetic acid, t-test (n = 36 in each group, *p < 0.05).
Figure Data
Acknowledgments
This image is the copyrighted work of the attributed author or publisher, and
ZFIN has permission only to display this image to its users.
Additional permissions should be obtained from the applicable author or publisher of the image.
Full text @ Front Cell Dev Biol