
Image
|
Figure Caption
Fig. 3
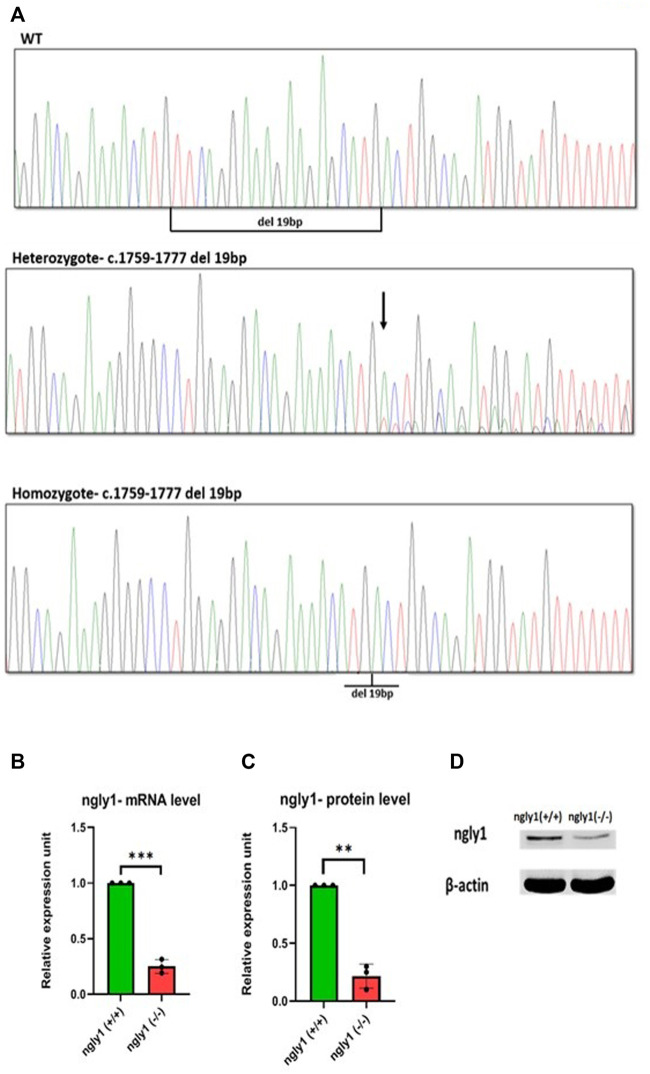
Mutation characterization in zebrafish- (A) Genotype screening in DNA extracted from zebrafish, Representative electrophoregrams indicating the sequences of WT, heterozygote and homozygote. (B) qPCR analysis quantification of ngly1 mRNA levels. t-test (ngly1 (+/+) n = 3, ngly1 (−/−) n = 3, ***p < 0.001). (C) WB analysis quantification of ngly1 protein levels. t-test (ngly1 (+/+) n = 3, ngly1 (−/−) n = 3, **p < 0.01). (D) WB analysis with an antibody against ZF ngly1; β-actin was used as a loading control.
Figure Data
Acknowledgments
This image is the copyrighted work of the attributed author or publisher, and
ZFIN has permission only to display this image to its users.
Additional permissions should be obtained from the applicable author or publisher of the image.
Full text @ Front Cell Dev Biol