
Image
|
Figure Caption
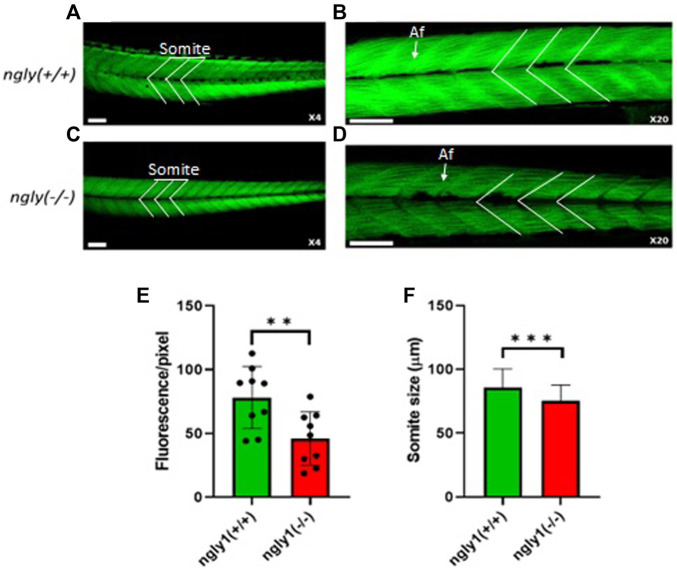
Fig. 5
Muscle structure morphology. Representation of ngly1 (+/+) (A,B) and ngly1 (−/−) (C,D) Phalloidin staining for actin (A-X4 and B-X20). Af = Actin filaments. (E) Quantification analysis of the Phalloidin fluorescence. t-test (n = 9 in each group, **p < 0.01). (F) Mean size of somite (µm). t-test (ngly1 (+/+), n = 65. ngly1 (−/−), n = 79, ***p < 0.001). Scale bars—50 µm.
Figure Data
Acknowledgments
This image is the copyrighted work of the attributed author or publisher, and
ZFIN has permission only to display this image to its users.
Additional permissions should be obtained from the applicable author or publisher of the image.
Full text @ Front Cell Dev Biol