
Fig. 4
- ID
- ZDB-IMAGE-220701-17
- Genes
- Publication
- Mesika et al., 2022 - NGLY1 Deficiency Zebrafish Model Manifests Abnormalities of the Nervous and Musculoskeletal Systems
- All Figures
- Figures for Mesika et al., 2022
|
Fig. 4
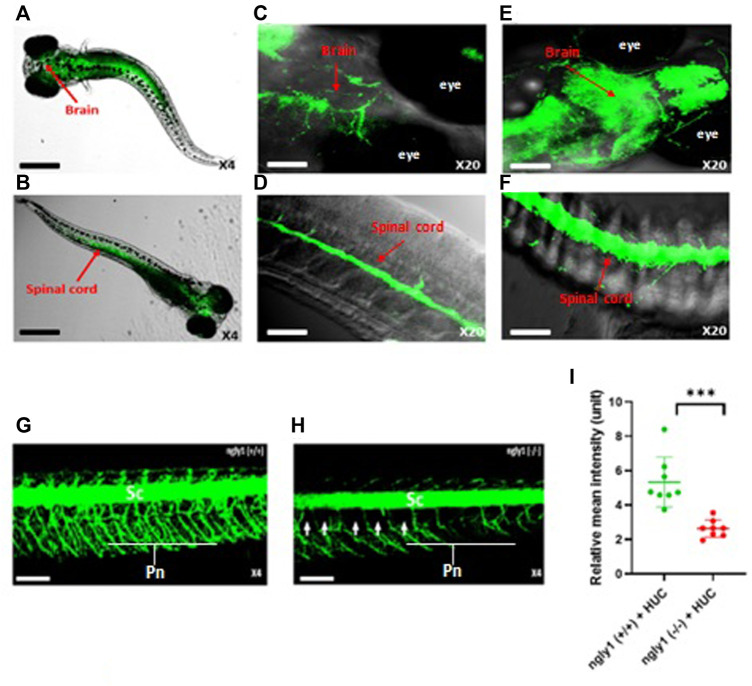
ngly1 (−/−) larvae displayed loss of axon fibers in the PNS compared to ngly1 (+/+). (A) Dorsal view and (B) ventral view (C) Brain (D) Spinal cord of 6dpf larvae (WT) identified by in situ hybridization analysis-X4, X20, confocal Nikon eclipse, n = 10. (E) Brain (F) Spinal cord of Tg (HUC:gal4 uas:mem YFP-mito CFP)- X20, confocal Nikon eclipse, n = 5. (G) ngly1 (+/+) control and (H) ngly1 (−/−) mutant groups at 6dpf. Sc = spinal cord, Pn = Peripheral nerves, white arrow represents the loss of axon fibers in PNS. X4, confocal Nikon eclipse. (I) Quantification of fluorescence by neurons, t-test (n = 8 in each group ***p < 0.001). Scale bars: black- 50 µm, white- 20 µm.