
- Title
-
Synthesis and Biological Evaluation of Highly Active 7-Anilino Triazolopyrimidines as Potent Antimicrotubule Agents
- Authors
- Oliva, P., Romagnoli, R., Cacciari, B., Manfredini, S., Padroni, C., Brancale, A., Ferla, S., Hamel, E., Corallo, D., Aveic, S., Milan, N., Mariotto, E., Viola, G., Bortolozzi, R.
- Source
- Full text @ Pharmaceutics
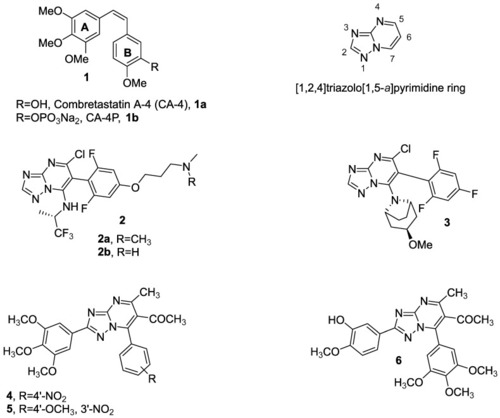
Structures of CA-4 (1a), CA-4P (1b) and several synthesized [1,2,4]triazolo [1,5-a]pyrimidine (2–6) reported in the literature. |
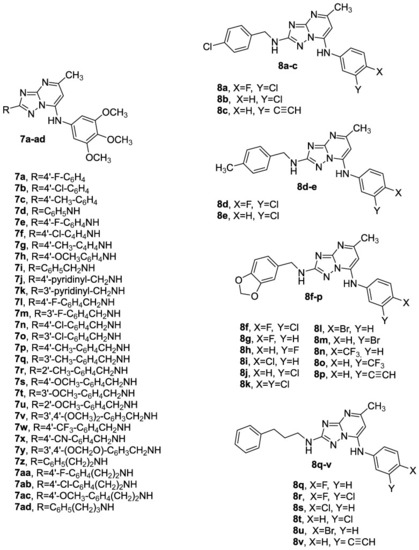
Chemical structures of compounds 7a–ad and 8a–v based on the [1,2,4]triazolo [1,5-a]pyrimidine scaffold. |
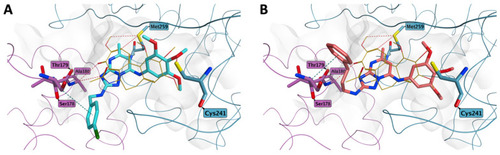
Proposed binding for compound 7n (A), and 7ad (B) in the colchicine site. Both the derivatives present the trimethoxyphenyl ring in proximity of βCys241, while the group at position 2 of the central core is sited at the interface between the two tubulin subunits, pointing toward a loop in the α-subunit (αSer178-αThr179). Co-crystallized colchicine is shown in light orange. The carbon atoms of the tubulin α subunit residues are shown in lilac, while the carbon atoms of the β subunit residues are represented in teal. |
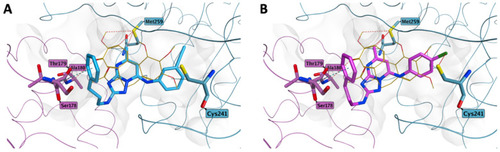
Proposed binding for compound 8v (A) and 8s (B) in the colchicine site. In both 3-phenylpropylamino derivatives, the differently substituted phenyl rings in position 7 do not affect the potential occupation of the colchicine site and are placed as for compound 7ad. Co-crystallized colchicine is shown in light orange. The carbon atoms of the tubulin α subunit residues are shown in lilac, while the carbon atoms of the β subunit residues are represented in teal. |

Microtubule organization in HeLa cells. Immunofluorescence analysis of HeLa cells after a 24 h treatment with 7ad, 8q or 8r at the indicated concentrations. Microtubules were labeled with an anti-β-tubulin antibody (green), and nuclei were stained with DAPI (blue). |
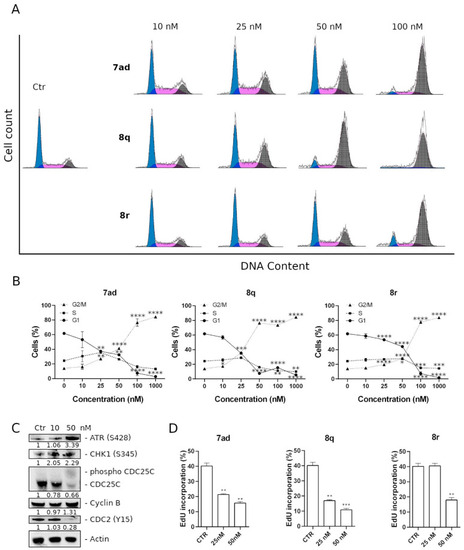
Representative histograms (A) and quantitative analysis (B) of cell cycle phase distribution after a 24 h treatment with 7ad, 8q or 8r at the indicated concentrations in HeLa cells. Cells were stained with PI to analyze the DNA content by flow cytometry. Data are presented as means of three independent experiments ± SEM ** p < 0.01, *** p < 0.001, **** p < 0.0001 (C) Effects of compound 8q on cell cycle regulatory proteins and DNA damage checkpoint proteins. HeLa cells were treated for 24 h with the indicated concentration of 8q and expression of ATR, CHK1, cdc25C, cyclin B, and cdc2 was detected by Western blot analysis. At the bottom of the gel are represented the values of the densitometric analysis indicated as a fold change with respect to the control and normalized with respect to the β-actin levels. (D) Analysis of the effect of 7ad, 8q and 8r on DNA synthesis and cell proliferation. HeLa cells were treated for 24 h with the indicated concentration of each compound, and next EdU incorporation was evaluated by flow cytometry. Histogram bars represent the % of EdU-positive cells. |
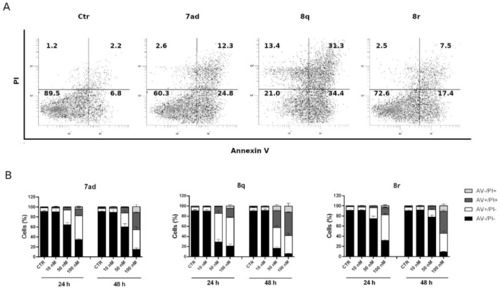
Apoptotic effects caused by 7ad, 8q and 8r. Representative flow cytometric plots (A) and histograms (B) of HeLa cells after 24 h treatments with compounds 7ad, 8q or 8r at the indicated concentrations. HeLa cells were analyzed by flow cytometry after double staining with annexin-V-FITC and PI. In the histograms, data are represented as mean ± SEM of three independent experiments. |
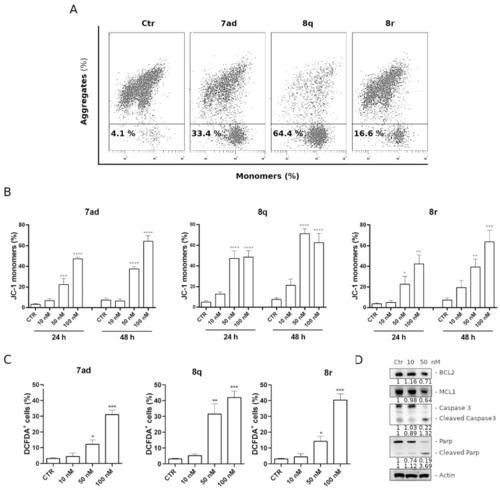
Assessment of mitochondrial depolarization after treatment with 7ad, 8q and 8r. Representative flow cytometric plots (A) and histograms (B) of HeLa cells after 24 h and 48 h treatments at the indicated concentrations. Data are represented as mean ± SEM of three independent experiments (** p < 0.01, *** p < 0.001, and **** p < 0.0001). (C) mitochondrial production of ROS in HeLa cells by compounds 7ad, 8q and 8r. After a 24 h incubation with the indicated compounds at different concentrations, cells were stained with H2DCFDA, and the fluorescence was analyzed by flow cytometry. Data in the histograms are expressed as mean ± SEM of three independent experiments (* p < 0.05, ** p < 0.01, *** p < 0.001 vs. control). (D) Western blot analysis of BCL-2, MCL-1, caspase-3 and PARP levels. HeLa cells were treated for 24 h with 8q at the indicated concentrations. At the bottom of each gel section are shown the values of the densitometric analyzes indicated as fold change with respect to the control and normalized with respect to the β-actin levels. |
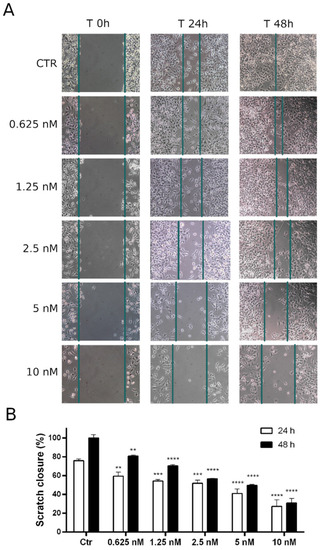
(A): representative images of wound closure at 24 and 48 h (10× magnification). Confluent HeLa cell monolayer was scratched and treated with 8q at the indicated concentrations. Wound closure was monitored for 24 and 48 h. (B): relative quantitation of the distance between scratch edges. Data are shown as mean ± SEM of three independent experiments ** p < 0.01, *** p < 0.001, and **** p < 0.0001 vs. the respective control). |
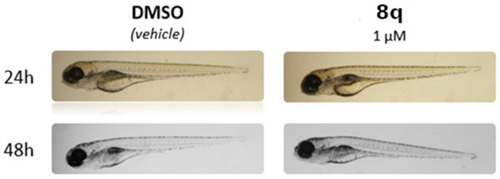
Effects of 8q treatment on zebrafish embryos. No abnormal phenotypes or developmental defects were seen in comparison to DMSO-treated embryos (as a normal control) after 24 and 48 h. |

Effects of 8q treatment on the zebrafish xenotransplantation model. (A): Representative images of Tg(fli1:EGFP) zebrafish embryos (with GFP-positive blood vessels) transplanted with DiI+ HeLa cells (red). Embryos were treated for 24 h with DMSO (control group), 290 nM 8q, or 145 nM 8q. The trunk region (dashed squares) of each animal was analyzed. Scale bar: 500 μm on the left, and 100 μm for higher magnifications on the right. (B): histograms represent the fluorescence intensity of the tumor xenografts, indicating total HeLa cells presents in each embryo after a 24 h treatment with 8q at the indicated concentrations. Data are expressed as mean ± SD (* p < 0.05, ** p < 0.01). |