
|
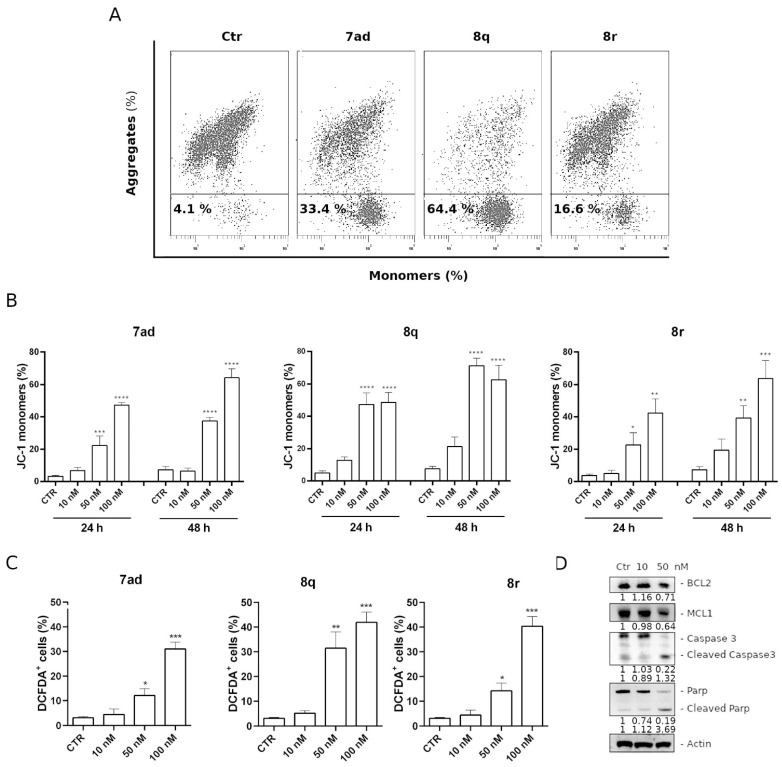
Fig. 8
Assessment of mitochondrial depolarization after treatment with 7ad, 8q and 8r. Representative flow cytometric plots (A) and histograms (B) of HeLa cells after 24 h and 48 h treatments at the indicated concentrations. Data are represented as mean ± SEM of three independent experiments (** p < 0.01, *** p < 0.001, and **** p < 0.0001). (C) mitochondrial production of ROS in HeLa cells by compounds 7ad, 8q and 8r. After a 24 h incubation with the indicated compounds at different concentrations, cells were stained with H2DCFDA, and the fluorescence was analyzed by flow cytometry. Data in the histograms are expressed as mean ± SEM of three independent experiments (* p < 0.05, ** p < 0.01, *** p < 0.001 vs. control). (D) Western blot analysis of BCL-2, MCL-1, caspase-3 and PARP levels. HeLa cells were treated for 24 h with 8q at the indicated concentrations. At the bottom of each gel section are shown the values of the densitometric analyzes indicated as fold change with respect to the control and normalized with respect to the β-actin levels.