
Image
|
Figure Caption
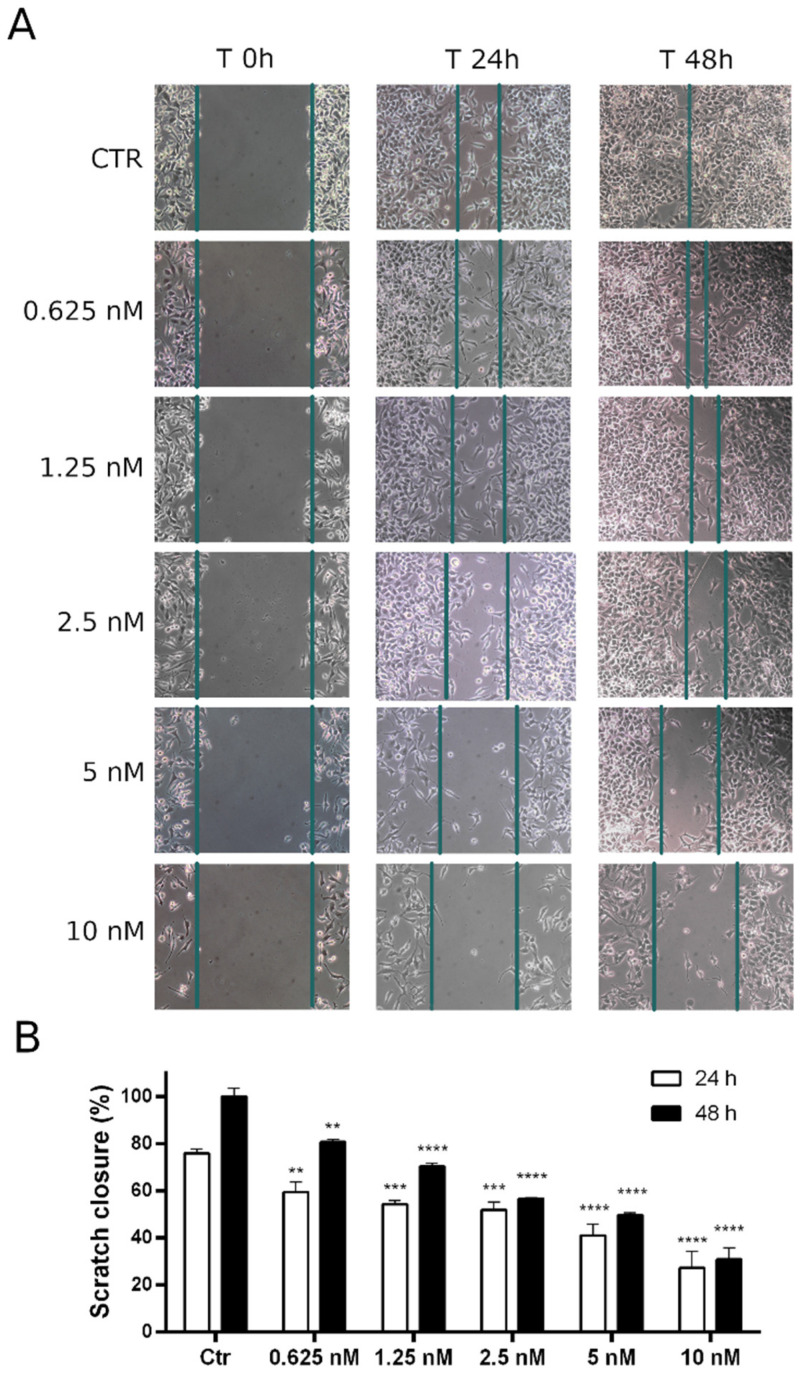
Fig. 9
(A): representative images of wound closure at 24 and 48 h (10× magnification). Confluent HeLa cell monolayer was scratched and treated with 8q at the indicated concentrations. Wound closure was monitored for 24 and 48 h. (B): relative quantitation of the distance between scratch edges. Data are shown as mean ± SEM of three independent experiments ** p < 0.01, *** p < 0.001, and **** p < 0.0001 vs. the respective control).
Acknowledgments
This image is the copyrighted work of the attributed author or publisher, and
ZFIN has permission only to display this image to its users.
Additional permissions should be obtained from the applicable author or publisher of the image.
Full text @ Pharmaceutics