
|
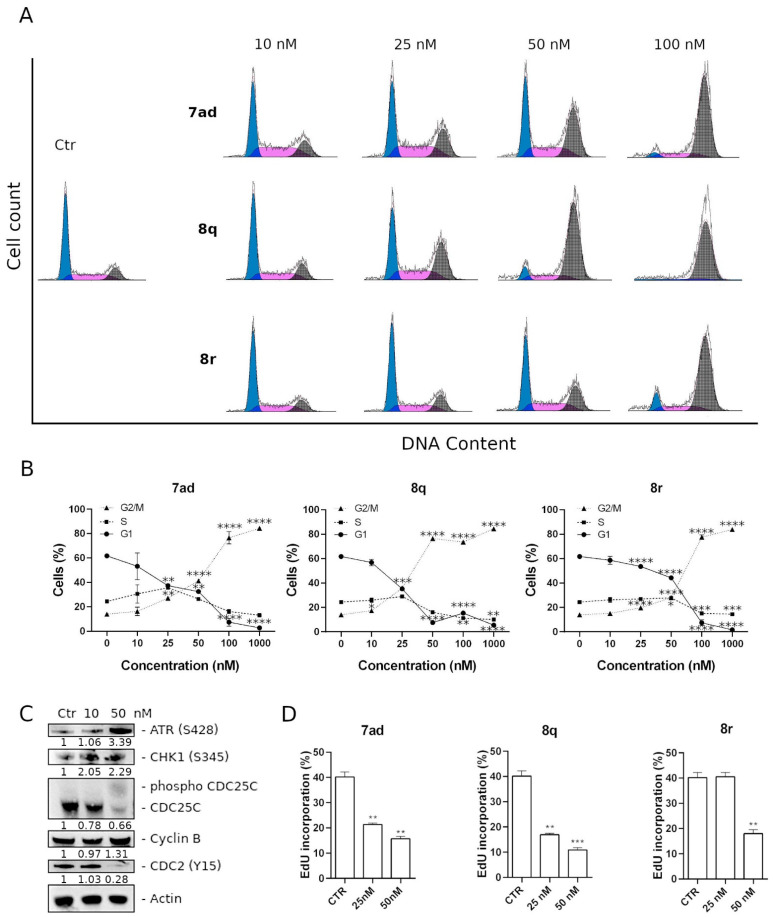
Fig. 6
Representative histograms (A) and quantitative analysis (B) of cell cycle phase distribution after a 24 h treatment with 7ad, 8q or 8r at the indicated concentrations in HeLa cells. Cells were stained with PI to analyze the DNA content by flow cytometry. Data are presented as means of three independent experiments ± SEM ** p < 0.01, *** p < 0.001, **** p < 0.0001 (C) Effects of compound 8q on cell cycle regulatory proteins and DNA damage checkpoint proteins. HeLa cells were treated for 24 h with the indicated concentration of 8q and expression of ATR, CHK1, cdc25C, cyclin B, and cdc2 was detected by Western blot analysis. At the bottom of the gel are represented the values of the densitometric analysis indicated as a fold change with respect to the control and normalized with respect to the β-actin levels. (D) Analysis of the effect of 7ad, 8q and 8r on DNA synthesis and cell proliferation. HeLa cells were treated for 24 h with the indicated concentration of each compound, and next EdU incorporation was evaluated by flow cytometry. Histogram bars represent the % of EdU-positive cells.