
- Title
-
The inhibition of protein translation promotes tumor angiogenic switch
- Authors
- Luo, H., Shen, Y., Liao, W., Li, Q., Wu, N., Zhong, J., Xiao, C., Gan, J., Yang, Y., Dong, E., Zhang, G., Liu, B., Yue, X., Xu, L., Liu, Y., Zhao, C., Zhong, Q., Yang, H.
- Source
- Full text @ Mol Biomed
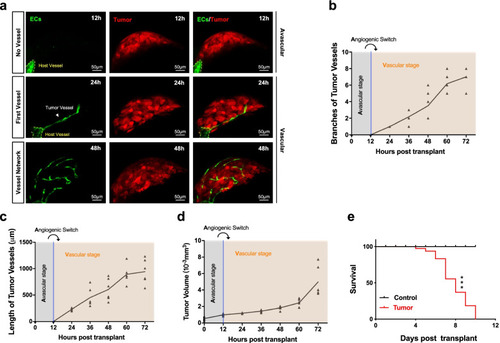
Angiogenic switch model in zebrafish. a Imaging of the tumor vascular growth with a confocal microscope. The first column indicates that the transplant microtumor does not yet have blood vessels (No vessel, Avascular phase). The second and third columns indicate the presence of blood vessels in the transplant microtumor (First vessel, Vessel network; Vascular phase). Endothelial cells (ECs) are green. Tumor is red. Yellow line, host vessel. White arrow, tumor vessel. Scale bar, 50 μm. b The branches and c length of tumor vessels and d tumor volume post tumor cells transplant for 72 h (n = 6). Light blue shade, avascular stage. Light orange shade, vascular stage. Light black curved arrow, angiogenic switch. e. Survival curve for zebrafish with or without transplant tumor cells for 10 days (n = 20). Log-rank (Mantel-Cox) test, *** P < 0.001 |

The angiogenic switch does not depend on hypoxia or Hif-1α. a Imaging of B16 cells incubated with hypoxia probe reagent (oxygen sensor) cultured under hypoxic or normoxia. Scale bar, 100 μm. b Imaging of the hypoxia probe reagent incubated transplant B16 microtumors under normoxia. Tumor is grey. Scale bar, 50 μm. c The length of the first vessel of the B16 microtumors under normoxia. d RT-qPCR quantification of the Hif1α expression in B16-Red cells transfected with Hif1α siRNA (50 μM) for 48 h (n = 3). NC, negative control. e Imaging of the first tumor vessel growth of Hif1α knockdown B16-Red transplant microtumors. Tumor is red. Scale bar, 50 μm. f The length of the first tumor vessel of Hif1α knockdown B16-Red transplant microtumors. g and h. RT-qPCR quantification of the Car9/CA9 and Slc2a1/GLUT1 expression in the transplant microtumors during the angiogenic switch (about 12 h and 24 h). Red fluorescence, hypoxia. ECs are green. Unpaired t-test, ns P > 0.05, *** P < 0.001 (n = 3–5) |
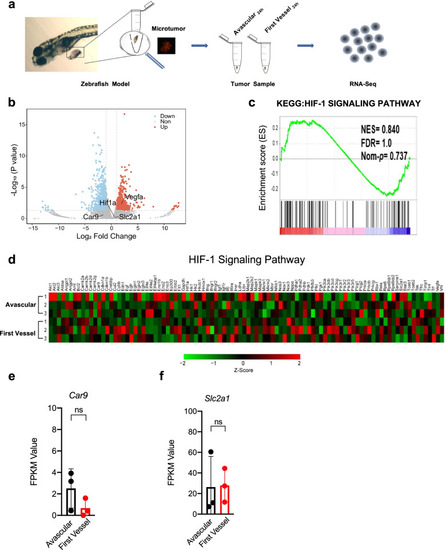
The angiogenic switch does not depend on HIF-1 signaling. a Schematics indicating the microsurgery of dissecting the transplant microtumors and transcriptome sequencing. Avascular, the tumor has not yet induced angiogenesis, which means ‘angiogenic switch’ is off (about 12 h); First vessel, the tumor induces the sprouting of the first vessel, which means ‘angiogenic switch’ is on (about 24 h). b The volcano plot of the gene expression change of the dissected transplant microtumors transcriptome during the angiogenic switch (n = 3). c The GSEA analysis and d the heat map of the HIF-1 signaling pathway during the angiogenic switch (n = 3). e and f The change of FPKM value of RNAseq data for Car9/CA9 and Slc2a1/GLUT1 |
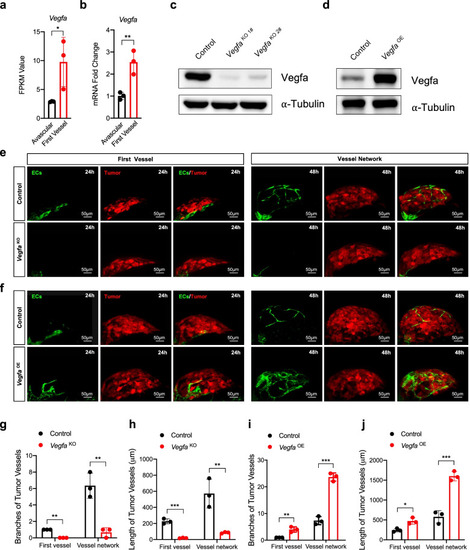
Angiogenic switch depends on Vegfa. a The change of FPKM value of RNA-seq data for Vegfa. b RT-qPCR quantification of Vegfa expression in the transplant microtumors during the angiogenic switch (about 12 h and 24 h). c and d Western blot analysis of Vegfa and α-tubulin of B16-Red cells transfected with LentiCRISPRv2-Vegfa, sg1# (VegfaKO 1#) or sg2# (VegfaKO 1#) knockout plasmid or pcDNA3.1-VEGFA overexpression plasmid (VegfaOE) for 48 h. e and f Imaging of the transplant tumor vascular growth of Vegfa knockout or overexpression B16-Red microtumors. ECs are green. Tumor is red. Scale bar, 50 μm. g-j The branches and length of the first vessel and vessel network. Unpaired t-test, *P < 0.05, ** P < 0.01, *** P < 0.001 (n = 3–5) |
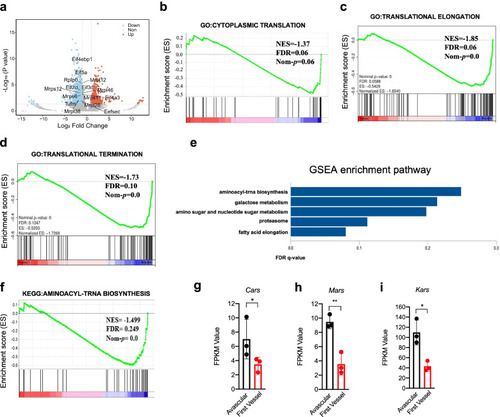
Inhibition of protein translation occurred during the angiogenic switch. a The volcano plot of the gene expression change of the dissected transplant microtumors transcriptome during the angiogenic switch (n = 3). b-d The GSEA analysis of transcriptome for the cytoplasmic translation, translational elongation and translational termination gene sets (n = 3). e The GSEA analysis of transcriptome for the significantly changed pathways during the angiogenic switch (n = 3). f The GSEA analysis of transcriptome for the aminoacyl-trans biosynthesis pathway during the angiogenic switch (n = 3). g-i The change of FPKM of RNAseq data for some aminoacyl-tRNA synthetases of the aminoacyl-trans biosynthesis during the angiogenic switch. Unpaired t-test, *P < 0.05, ** P < 0.01 (n = 3) |

The reduction of protein translation promotes Vegfa expression independent of Hif1α. a Western blot analysis of the p-Eif2α, Eif2α, and α-tubulin of B16-Red transplant microtumor at avascular (about 12 h)and first vessel stage (about 24 h) (n = 50). b Western blot analysis of the p-Eif2α, Eif2α, and α-tubulin of B16-Red tumor spheroids at 0, 12 and 24 h. c RT-qPCR quantification of Vegfa expression in B16-Red tumor spheroids at 0, 12 and 24 h. d Western blot analysis of the p-Eif2α, Eif2α, and α-tubulin of puromycin (2 μg/mL) treated B16-Red cells at 0, 1 and 3 h. e–h RT-qPCR quantification of Vegfa expression in puromycin (4 μg/mL) treated B16-Red cells or in puromycin (1 μg/mL) treated H460, SKOV3 and A2780s cells for 24 h. i-l RT-qPCR quantification of Vegfa expression in cycloheximide (800 μM) treated B16-Red and H460 or in cycloheximide (200 μM) treated SKOV3 and A2780s cells for 24 h. m RT-qPCR quantification of Vegfa expression in B16-Red cells. Untreated (Control), negative control or Hif1α siRNA transfected for 48 h (siNC or siHif1α), puromycin (2 μg/mL) treated for 24 h (Puromycin), and puromycin (2 μg/mL) treated for 24 h and Hif1α siRNA transfected for 48 h (siHif1α + Puromycin). Control, Con. Puromycin, Puro. Cycloheximide, CHX. Unpaired t-test, *P < 0.05, ** P < 0.01, *** P < 0.001 (n = 3) |
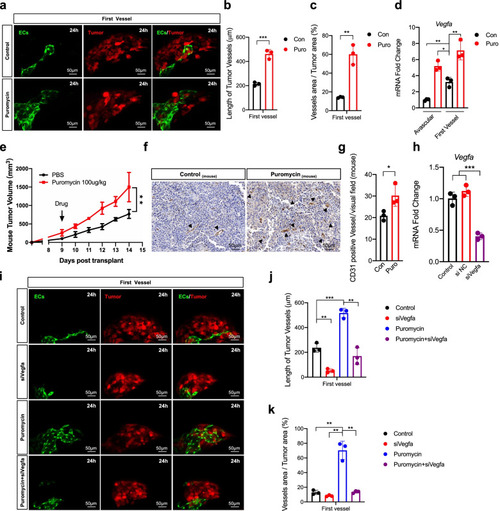
Inhibition of protein translation by puromycin promotes angiogenic switch depending on Vegfa. a Imaging of the first vessel sprouting of B16-Red transplant microtumors treated with puromycin (2 μg/mL) for 24 h before transplant. Scale bar, 50 μm. b and c The length of vessels and the ratio of vessels area versus tumor area of the first vessel. d RT-qPCR quantification of the Vegfa expression in the puromycin treated microtumors during the angiogenic switch(about 12 h and 24 h). e The mouse tumor volume of puromycin (100ug/Kg, intratumor) treated tumors. f CD31 staining of mouse tumors on day 14. Black arrow, CD31 positive tumor vessels. Scale bar: 50 μm. g The density of CD31 positive mouse tumor vessels per visual field. h RT-qPCR quantification of the Vegfa expression in B16-Red cells transfected with Vegfa siRNA (100 μM) for 48 h (n = 3). NC, negative control. i Imaging of the first vessel sprouting of B16-Red transplant microtumors treated with puromycin (2 μg/mL) for 24 h, transfected with Vegfa siRNA (100 μM) for 48 h, and treated with puromycin (2 μg/mL) for 24 h and transfected with Vegfa siRNA (100 μM) for 48 h before transplant. Scale bar, 50 μm. j and k The length of vessels and the ratio of vessels area versus tumor area of B16-Red transplant microtumor of the first vessel. ECs are green. Tumor is red. Control, Con. Puromycin, Puro. Unpaired t-test, *P < 0.05, ** P < 0.01, *** P < 0.001 (n = 3) |