
Fig. 7
- ID
- ZDB-IMAGE-220620-43
- Publication
- Luo et al., 2022 - The inhibition of protein translation promotes tumor angiogenic switch
- All Figures
- Figures for Luo et al., 2022
|
Fig. 7
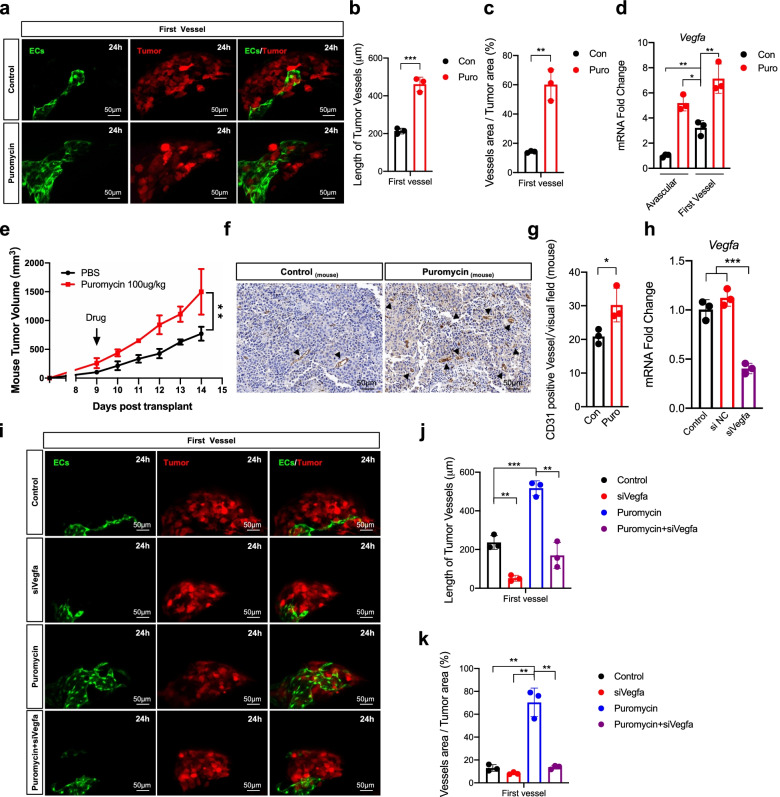
Inhibition of protein translation by puromycin promotes angiogenic switch depending on Vegfa. a Imaging of the first vessel sprouting of B16-Red transplant microtumors treated with puromycin (2 μg/mL) for 24 h before transplant. Scale bar, 50 μm. b and c The length of vessels and the ratio of vessels area versus tumor area of the first vessel. d RT-qPCR quantification of the Vegfa expression in the puromycin treated microtumors during the angiogenic switch(about 12 h and 24 h). e The mouse tumor volume of puromycin (100ug/Kg, intratumor) treated tumors. f CD31 staining of mouse tumors on day 14. Black arrow, CD31 positive tumor vessels. Scale bar: 50 μm. g The density of CD31 positive mouse tumor vessels per visual field. h RT-qPCR quantification of the Vegfa expression in B16-Red cells transfected with Vegfa siRNA (100 μM) for 48 h (n = 3). NC, negative control. i Imaging of the first vessel sprouting of B16-Red transplant microtumors treated with puromycin (2 μg/mL) for 24 h, transfected with Vegfa siRNA (100 μM) for 48 h, and treated with puromycin (2 μg/mL) for 24 h and transfected with Vegfa siRNA (100 μM) for 48 h before transplant. Scale bar, 50 μm. j and k The length of vessels and the ratio of vessels area versus tumor area of B16-Red transplant microtumor of the first vessel. ECs are green. Tumor is red. Control, Con. Puromycin, Puro. Unpaired t-test, *P < 0.05, ** P < 0.01, *** P < 0.001 (n = 3)