
- Title
-
Serotonin (5-HT) 2A Receptor Involvement in Melanin Synthesis and Transfer via Activating the PKA/CREB Signaling Pathway
- Authors
- Yue, Y., Zhong, M., An, X., Feng, Q., Lai, Y., Yu, M., Zhang, X., Liao, Z., Chen, M., Dong, J., Zhong, H., Shang, J.
- Source
- Full text @ Int. J. Mol. Sci.

Figure 1. 5-HT induces melanogenesis in B16F10 and zebrafish embryos: (a) Masson–Fonta staining of B16F10 cells to show the melanocytes morphology and melanin content with the treatment of different concentrations of 5-HT (10, 50, and 100 μM), α-MSH (50 nM) was used as a positive control. Scale bar, 50 μm; (b,c) relative tyrosinase activity (b) and melanin content (c) in B16F10 cells treated with 5-HT (10, 50, and 100 μM) (n = 6). The photos of melanin precipitation in the tube are at the top of the diagram (c); (d) Western blot shows the protein expression of melanin synthesis, MITF, and TYR in B16F10 cells treated with 5-HT (10, 50, and 100 μM); (e) the drug treatment strategy in zebrafish, 0.2 mM PTU (9–35 hpf) resulted in depigmentation in zebrafish, then 0.2 mM PTU or specific drug was added to explore the recovery of pigment in the zebrafish embryos at 60 hpf; (f) the morphology of melanocytes in zebrafish embryos at 60 hpf treated with 5-HT (0.1, 0.5, and 1 mM) from 35–60 hpf. The left column shows the whole view of zebrafish embryos (lateral view). The right three columns show the amplification photos of head (lateral view), trunk (lateral view), and head (dorsal view). Scale bar, 100 μm. * (p < 0.05) and ** (p < 0.01) compared to control group.
PHENOTYPE:
|
|
Figure 2. HTR2A antagonist AT1015 inhibits the melanogenesis promotion effect of 5-HT in B16F10 cells and zebrafish embryos: (a) Masson–Fonta staining of B16F10 cells to show the melanocytes morphology and melanin content with the treatment of 5-HT (100 μM), HTR2A antagonist AT1015 (3 μM), and cotreatment. Scale bar, 50 μm; (b,c) relative tyrosinase activity (b) and melanin content (c) in B16F10 cells treated with 5-HT (100 μM) and different concentrations of AT1015 (0.1, 0.3, 1, and 3 μM) as compared with the control (n = 6). The photos of melanin precipitation in the tube are at the top of the diagram (c); (d) Western blot shows the protein expression of melanin synthesis, MITF, and TYR in B16F10 cells treated with 5-HT (100 μM) or cotreated with AT1015 (3 μM) or ketanserin (30 μM); (e) the morphology of melanocytes in zebrafish embryos at 60 hpf. The left column shows the whole view of zebrafish embryos (lateral view). The right three columns show the amplification photos of head (lateral view), trunk (lateral view), and head (dorsal view). Scale bar, 100 μm. * (p < 0.05) and ** (p < 0.01) compared to control group; # (p < 0.05) and ## (p < 0.01) compared to 5-HT group.
|
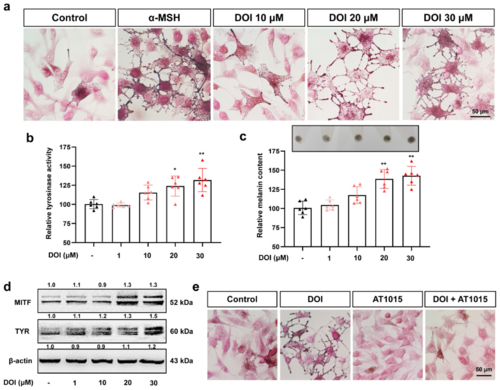
Figure 3. HTR2A agonist DOI induces melanogenesis in B16F10 cells: (a) Masson–Fonta staining of B16F10 cells treated with HTR2A agonist DOI (10, 20, and 30 μM) and α-MSH (50 nM) used as a positive control. Scale bar, 50 μm; (b,c) relative tyrosinase activity (b) and melanin content (c) in B16F10 cells treated with different concentrations of DOI (1, 10, 20, and 30 μM) as compared with the control (n = 6). The photos of melanin precipitation in the tube are at the top of the diagram (c); (d) Western blot shows the protein expression of melanin synthesis, MITF, and TYR in B16F10 cells treated with DOI (1, 10, 20, and 30 μM); (e) Masson–Fonta staining of B16F10 cells with the treatment of DOI (30 μM), HTR2A antagonist AT1015 (3 μM), and cotreatment. Scale bar, 50 μm. * (p < 0.05) and ** (p < 0.01) compared to control group.
|
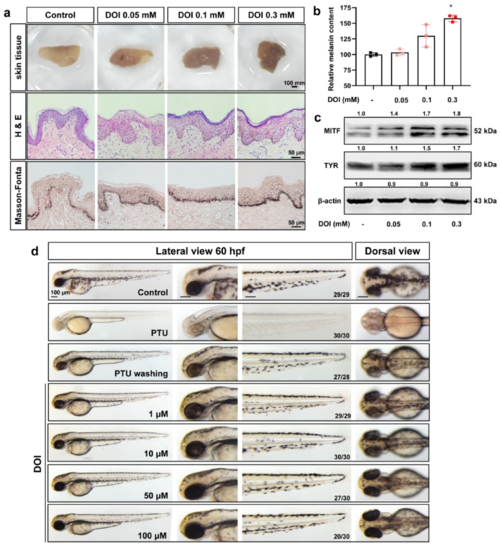
Figure 4. HTR2A agonist DOI increases the melanogenesis in cultured human skin tissue and zebrafish embryos. (a). The morphological photos, H&E staining and Masson-Fonta staining of human skin tissue treated with HTR2A agonist DOI (0.05, 0.1, and 0.3 mM). Scale bar, 100 mm (morphology of skin tissue), 50 μm (H&E staining and Masson-Fonta staining). (b). Relative melanin content in human skin tissue treated with DOI (0.05, 0.1, and 0.3 mM) as compared with the control (n = 3). (c). Western blot shows the protein expression of MITF and TYR in human skin tissue treated with DOI (0.05, 0.1, and 0.3 mM). (d). The morphology of melanocytes in zebrafish embryos at 60 hpf treated with DOI (1, 10, 50, and 100 μM) from 35–60 hpf. The left column shows the whole view of zebrafish embryos (lateral view). The right three columns show the amplification photos of head (lateral view), trunk (lateral view) and head (dorsal view). Scale bar, 100 μm.* (p < 0.05) compared to control group.
|
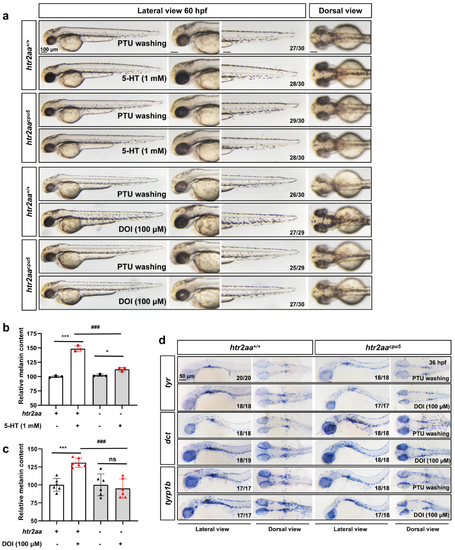
Figure 5. Htr2aa knockout in zebrafish attenuated the melanogenesis promotion of 5-HT and HTR2A agonist: (a) The morphology of melanocytes in zebrafish embryos at 60 hpf treated with 5-HT (1 mM) and DOI (100 μM) in wild-type siblings and htr2aa knockout zebrafish line htr2aacpu5 from 35–60 hpf. The left column shows the whole view of zebrafish embryos (lateral view). The right three columns show the amplification photos of head (lateral view), trunk (lateral view), and head (dorsal view). Scale bar, 100 μm; (b,c) relative melanin content in zebrafish embryos with or without htr2aa treated with 5-HT (b) (n = 3) or DOI (c) (n = 6); *** (p < 0.001) compared to control group; * (p < 0.05) and ns (no significance) compared to htr2aa−/− zebrafish; ### (p < 0.001) compared to wild type zebrafish with 5-HT or DOI treatment. (d) the whole mount in situ hybridization to show the expression of melanin synthesis genes, tyr, dct and tyrp1b, in wild-type siblings and htr2aa knockout zebrafish line htr2aacpu5 at 36 hpf treated with or without DOI (100 μM). Scale bar, 50 μm.
|
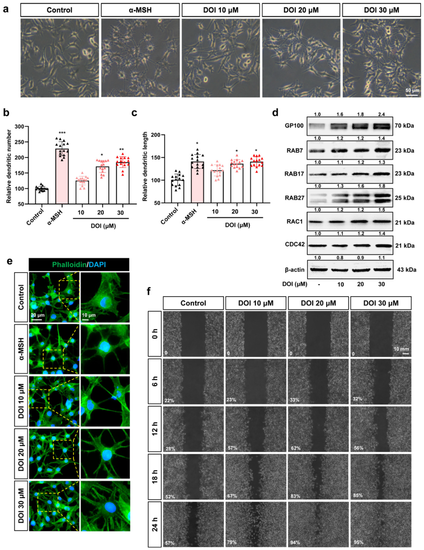
Figure 6. HTR2A agonist DOI induces dendrites and migration of B16F10 cells: (a) The cell morphology of B16F10 cells treated with different concentrations of DOI (10, 20, and 30 μM) and α-MSH (50 nM) is used as a positive control. Scale bar, 50 μm; (b,c) the dendritic number (b) and length (c) of the B16F10 cells treated with different concentrations of DOI (10, 20, and 30 μM) (n = 15); (d) Western blot shows the protein expression of GP100 (melanosome organization), RAB7/17/27 (melanosome transport), RAC1, and CDC42 (melanocytes dendrites) in B16F10 cells treated with DOI (10, 20, and 30 μM); (e) phalloidin staining shows the cytoskeleton in B16F10 cells treated with DOI (10, 20, and 30 μM). DAPI was used to mark the nucleus. The right row is the partial enlargement of the photos on the left. Scale bar, 20 μm (left), 10 μm (right); (f) cell scratch experiments show the migration of B16F10 after treatment with DOI (10, 20, and 30 μM) from 0 to 24 h. Percentage (%) of gap filling/wound healing was used to indicate the migration ability of B16F10 cells. Scale bar, 10 mm. * (p < 0.05), ** (p < 0.01) and *** (p < 0.001) compared to control group.
|
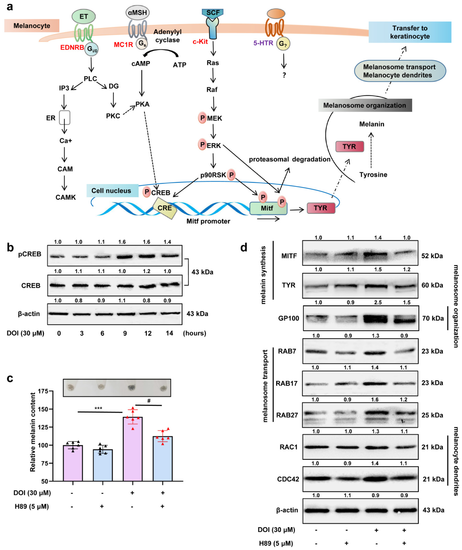
Figure 7. HTR2A agonist promotes melanin synthesis and melanosome transport through the PKA/CREB signaling pathway: (a) Schematic diagram shows the classical signals involved in the initiation of melanogenesis and the process of melanin synthesis and melanin transfer to neighboring keratinocytes; (b) Western blot shows the protein expression of phospho-CREB and total CREB in B16F10 cells after treatment with DOI (30 μM) from 0–14 h; (c) relative melanin content in B16F10 cells treated with DOI (30 μM), H89 (the inhibitor of PKA signaling, 5 μM), and cotreatment as compared with the control (n = 3). The photos of melanin precipitation in the tube are at the top of the diagram (c); (d) Western blot shows the protein expression of MITF and TYR (melanin synthesis), GP100 (melanosome organization), RAB7/17/27 (melanosome transport), RAC1, and CDC42 (melanocytes dendrites) in B16F10 cells treated with DOI (30 μM), H89 (5 μM), and cotreatment. *** (p < 0.001) compared to control group; # (p < 0.05) compared to the group of B16F10 cells treated with DOI.
|