
- Title
-
Midnight/midday-synchronized expression of cryptochrome genes in the eyes of three teleost species, zebrafish, goldfish, and medaka
- Authors
- Nakagawa, M., Okano, K., Saratani, Y., Shoji, Y., Okano, T.
- Source
- Full text @ Zoological Lett
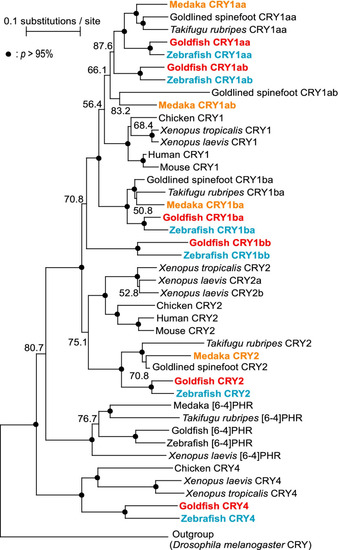
Molecular phylogenetic tree of the CRY / Photolyase family. A molecular phylogenetic tree was constructed by ClustalW (ver. 2.1). The accession numbers for all genes are shown in Table S1. Bootstrap probabilities (p) of 95% or more are indicated using closed circles, and numbers below 95% are shown. In this study, we investigated the expression of Cry mRNA in zebrafish (blue), goldfish (red), and medaka (orange) |
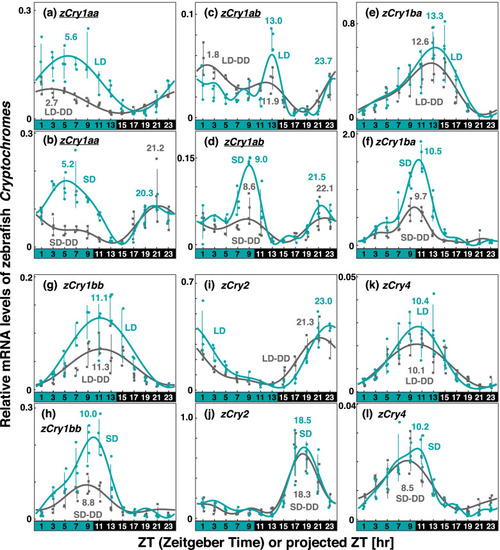
Comparison of Cry expression profiles in zebrafish eyes under various light conditions. Eyeballs (n = 3–4) were collected every 2 h from zebrafish entrained under turquoise green light on long-days or short-days during (LD or SD, green dots) or on the first day in DD after LD or SD entrainment (LD-DD or SD-DD, gray squares). Expression levels of each mRNA were calculated relative to the synergistic mean of zEf1α and zGapdh expression levels. Error bars indicate standard deviation. The expression profiles approximated by the cosinor fitting are indicated (LD or SD, green curves; LD-DD or SD-DD, gray curves) with the estimated peak time. The results of Kruskal–Wallis test and Dann-Bonferroni post-hoc test are shown in Table S3 and Figs S2-S5, respectively. Cry genes showing significant change (p < 0.05, Mann–Whitney U test) in the averaged mRNA levels between LD/SD and LD-DD/SD-DD are underlined. Light and dark conditions are indicated at the bottom of each panel |
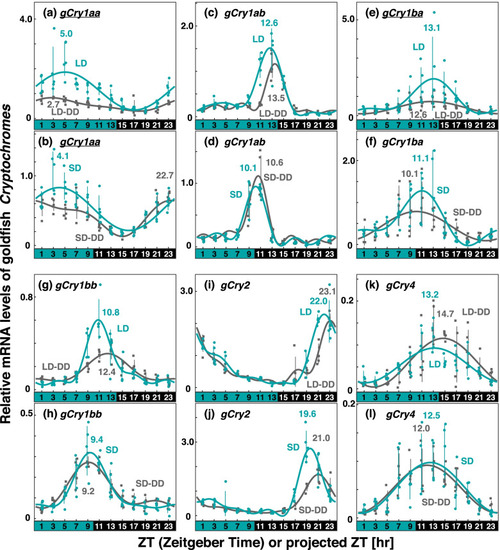
Comparison of Cry expression profiles in goldfish eyes under various light conditions. Eyeballs (n = 4–5) were collected every 2 h from goldfish entrained under turquoise green light on long-days or short-days during (LD or SD, green dots) or on the first day in DD after LD or SD entrainment (LD-DD or SD-DD, gray squares). Expression levels of each mRNA were calculated relative to the synergistic mean of gGusb, gPgk1, and gHprt1 expression levels. Error bars indicate standard deviation. The expression profiles approximated by the cosinor fitting are indicated (LD or SD, green curves; LD-DD or SD-DD, gray curves) with the estimated peak time. The results of Kruskal–Wallis test and Dann-Bonferroni post-hoc test are shown in Table S4 and Figs S6–S9, respectively. Cry genes showing significant change (p < 0.05, Mann–Whitney U test) in the averaged mRNA levels between LD/SD and LD-DD/SD-DD are underlined. Light and dark conditions are indicated at the bottom of each panel |
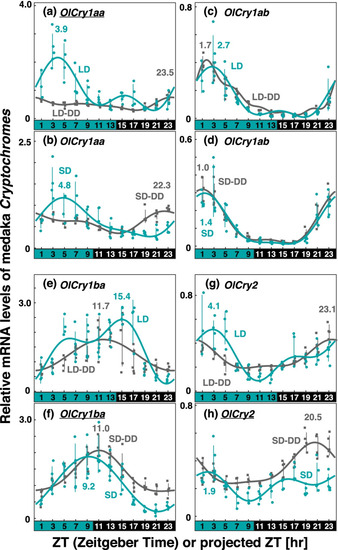
Comparison of Cry expression profiles in medaka eyes under various light conditions. Eyeballs (n = 3–5) were collected every 2 h from medaka entrained under turquoise green light on long-days or short-days during (LD or SD, green dots) or on the first day in DD after LD or SD entrainment (LD-DD or SD-DD, gray squares). Expression levels of each mRNA were calculated relative to the synergistic mean of OlGusb, OlEf1α, and OlHprt1 expression levels. Error bars indicate standard deviation. The expression profiles approximated by the cosinor fitting are indicated (LD or SD, green curves; LD-DD or SD-DD, gray curves) with the estimated peak time. The results of Kruskal–Wallis test and Dann-Bonferroni post-hoc test are shown in Table S5 and Figs S10–S13, respectively. Cry genes showing significant change (p < 0.05, Mann–Whitney U test) in the averaged mRNA levels between LD/SD and LD-DD/SD-DD are underlined. Light and dark conditions are indicated at the bottom of each panel |
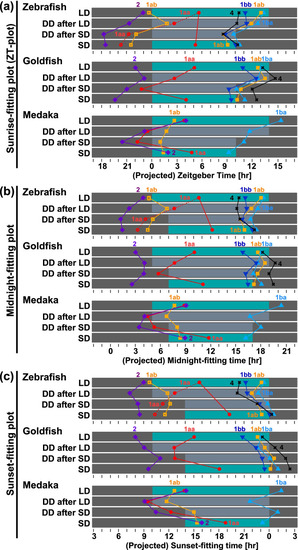
Phase shifts of Cry expression under various light conditions. The peak time (acrophase) obtained from the fitted curve by the cosinor fitting is plotted against the time elapsed from the beginning of the light period (panel a, sunrise-fitting plot), the middle of the night (panel b, midnight-fitting plot), and the beginning of the dark period (panel c, sunset-fitting plot). The morning peak of zCry1ab is indicated as yellow open squares, and the evening peak is shown using yellow closed squares. Blue/dark bars indicate light conditions and gray bars indicate the subjective night period. LD, long-day; SD, short-day; DD after LD, constant dark just after the long-day entrainment (LD-DD in the text); DD after SD, constant dark just after the short-day entrainment (SD-DD in the text) |

Comparison of expression profiles of Cry genes in LD or SD aligned to sunrise, midnight, or sunset. a, d, g Expression profiles of the genes with the minimum shifts in the Zeitgeber Time (ZT) plot. b, e, h Expression profiles of the genes with the minimum shifts in the midnight-fitting plot (hours after midnight). c, i Expression profiles of the genes with the minimum shifts in the sunset-fitting plot (hours after sunset). There was no gene for sunset-fitting plot in goldfish (f). The expression profiles approximated using the cosinor fitting in LD and SD are shown in normal curves and dotted curves, respectively |
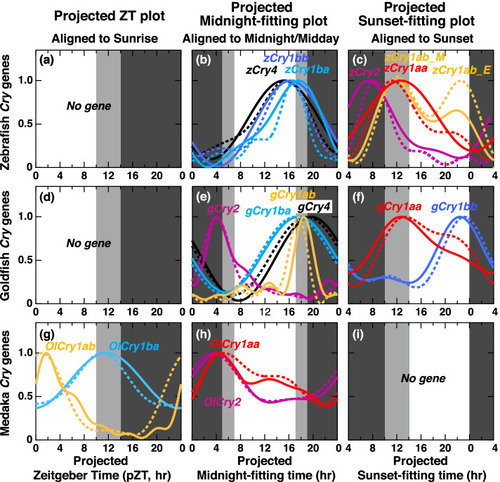
Comparison of expression profiles of Cry genes in the dark after entrainment under LD (LD-DD) or SD (SD-DD) aligned to projected sunrise, midnight, or sunset. g Expression profiles of the genes with the minimum shifts in the projected Zeitgeber Time (pZT) plot. b, e, h Expression profiles of the genes with the minimum shifts in the projected midnight-fitting plot. c, f Expression profiles of the genes with the minimum shifts in the projected sunset-fitting plot. There was no gene for pZT plot in zebrafish (a) or goldfish (d) or projected sunset-fitting plot in medaka (i). The expression profiles approximated using the cosinor fitting in LD-DD and SD-DD are shown in normal curves and dotted curves, respectively |