
Fig. 2
|
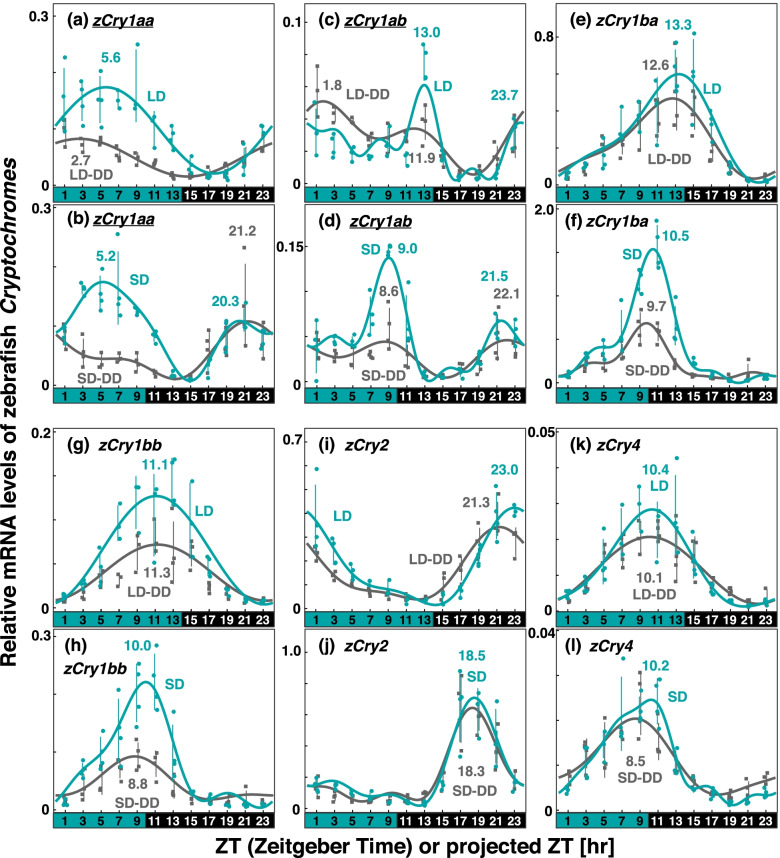
Fig. 2 Comparison of Cry expression profiles in zebrafish eyes under various light conditions. Eyeballs (n = 3–4) were collected every 2 h from zebrafish entrained under turquoise green light on long-days or short-days during (LD or SD, green dots) or on the first day in DD after LD or SD entrainment (LD-DD or SD-DD, gray squares). Expression levels of each mRNA were calculated relative to the synergistic mean of zEf1α and zGapdh expression levels. Error bars indicate standard deviation. The expression profiles approximated by the cosinor fitting are indicated (LD or SD, green curves; LD-DD or SD-DD, gray curves) with the estimated peak time. The results of Kruskal–Wallis test and Dann-Bonferroni post-hoc test are shown in Table S3 and Figs S2-S5, respectively. Cry genes showing significant change (p < 0.05, Mann–Whitney U test) in the averaged mRNA levels between LD/SD and LD-DD/SD-DD are underlined. Light and dark conditions are indicated at the bottom of each panel