
|
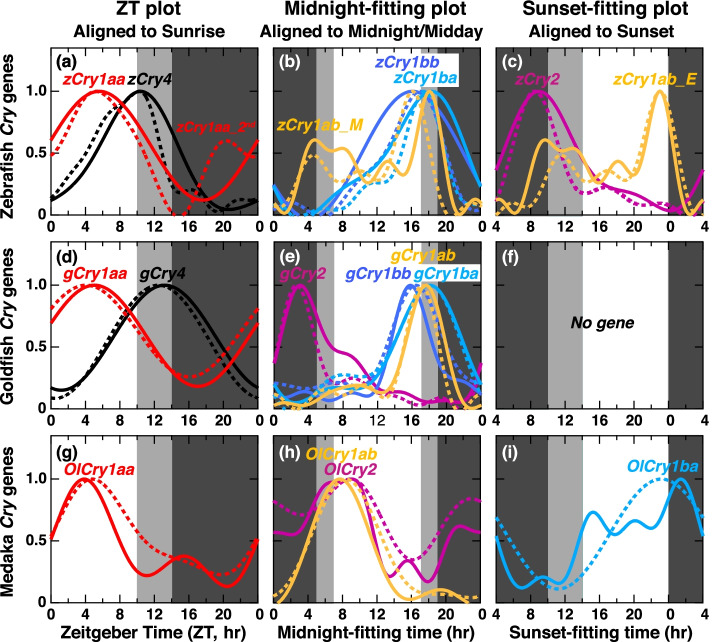
Fig. 6 Comparison of expression profiles of Cry genes in LD or SD aligned to sunrise, midnight, or sunset. a, d, g Expression profiles of the genes with the minimum shifts in the Zeitgeber Time (ZT) plot. b, e, h Expression profiles of the genes with the minimum shifts in the midnight-fitting plot (hours after midnight). c, i Expression profiles of the genes with the minimum shifts in the sunset-fitting plot (hours after sunset). There was no gene for sunset-fitting plot in goldfish (f). The expression profiles approximated using the cosinor fitting in LD and SD are shown in normal curves and dotted curves, respectively