
- Title
-
Lactate metabolism coordinates macrophage response and regeneration in zebrafish
- Authors
- Bohaud, C., Cruz, J., Terraza, C., Barthelaix, A., Laplace-Builhé, B., Jorgensen, C., Arribat, Y., Djouad, F.
- Source
- Full text @ Theranostics
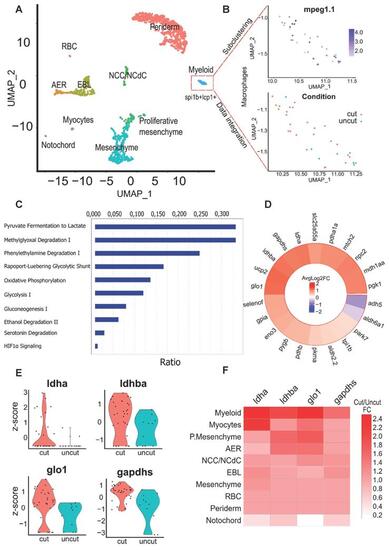
Identification of key pathways modulated within macrophages of the regenerating caudal fin from Single-cell RNAseq data. (A) Clustering of the integrated data from the 24 hpA caudal fin (cut) and their uninjured counterparts (uncut). AER: apical ectodermal ridge, EBL: epithelial basal layers, NCC/NCdC: Neural crest cells/NCC derived cells. (B) Feature plot of macrophages subset based on mpeg1.1 expression and dimensional reduction plot of their distribution through the cut and uncut conditions. (C) Canonical pathway analysis from the Ingenuity Pathway analysis (IPA) of the metabolic network. Ratio (genes detected / total number of genes of the pathway) within macrophages subset. (D) Heatmap of the cut/uncut gene expression ratio of the main glycolysis associated-genes (E) Violin plots of the top differentially expressed glycolytic and lactate-associated genes within cut and uncut conditions. (F) Heatmap of the cut/uncut expression fold change for the top DE genes through the different caudal fin cell populations. |
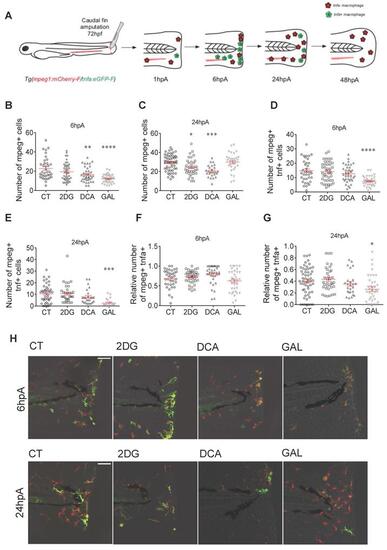
Glycolytic and lactate inhibitors alter the recruitment and the polarization of macrophages. (A) Experimental design of macrophage recruitment, migration, and polarization after amputation. (B) Graph showing the quantification of the number of mpeg+ macrophages in the entire fin at 6 hpA after amputation and immersion with zebrafish water (CT), 2DG (50 μM), DCA (500 μM), or GAL (500 nM) (mean ± SEM, n > 30, ordinary one-way ANOVA, Dunnett's multiple comparisons test, compared to control, **p ≤ 0.01, ****p ≤ 0.0001). (C) Graph showing the quantification of the number of mpeg+ macrophages in the entire fin at 24 hpA after amputation and immersion with zebrafish water (CT), 2DG (50 μM), DCA (500 μM), or GAL (500 nM) (mean ± SEM, n< 30, Kruskal-Wallis, Dunn's multiple comparisons test, compared to control, *p ≤ 0.05, ***p ≤ 0.001). (D) Graph showing the quantification of the number of mpeg+tnfa+ macrophages in the entire fin at 6 hpA after amputation and immersion with zebrafish water (CT), 2DG (50 μM), DCA (500 μM), or GAL (500 nM) (mean ± SEM, n > 30, ordinary one-way ANOVA, Dunnett's multiple comparisons test, compared to control, ****p ≤ 0.0001). (E) Graph showing the quantification of the number of mpeg+tnfa+ macrophages in the entire fin at 24 hpA after amputation and immersion with zebrafish water (CT), 2DG (50 μM), DCA (500 μM), or GAL (500 nM) (mean ± SEM, n > 30, ordinary one-way ANOVA, Dunnett's multiple comparisons test, compared to control, ***p ≤ 0.001). (F) Graph showing the relative number of mpeg+tnfa+ macrophages (fold change of mpeg+tnfa+ macrophages over the total number of mpeg+ macrophages macrophages) in the entire fin at 6 hpA after amputation and immersion with zebrafish water (CT), 2DG (50 μM), DCA (500 μM), or GAL (500 nM) (mean ± SEM, n > 30, ordinary one-way ANOVA, Dunnett's multiple comparisons test, compared to control, non-significant). (G) Graph showing the relative number of mpeg+tnfa+ macrophages (fold change of mpeg+ tnfa+ macrophages over the total number of mpeg+ macrophages) in the entire fin at 24 hpA after amputation and immersion with zebrafish water (CT), 2DG (50 μM), DCA (500 μM), or GAL (500 nM) (mean ± SEM, n > 30, ordinary one-way ANOVA, Dunnett's multiple comparisons test, compared to control, *p ≤ 0.05). (H) Z projection of confocal images illustrating macrophage recruitment and activation at 6 and 24 hpA after amputation and immersion with zebrafish water (CT), 2DG (50 μM), DCA (500 μM), or GAL (500 nM) (Scale bar = 60 μm). |
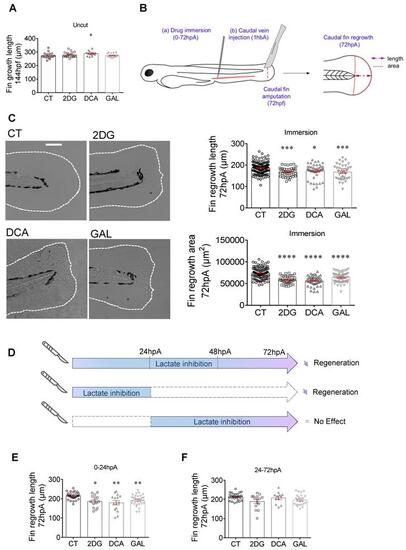
Glycolytic and lactate inhibitors impact on the caudal fin regeneration after amputation. (A) Graph showing the fin growth length of uncut larvae at 144 hpf when immersed in zebrafish water (CT), or when immersed in 2DG (50 μM), DCA (500 μM), or in GAL (500 nM) (mean ± SEM, n < 30, Kruskal-Wallis, Dunn's multiple comparisons test, compared to control, *p ≤ 0.05). (B) Design of the experiment: (a) add drugs in immersion from 0 until 72 hpA, or (b) add drug in caudal vein injection at 1 hour before amputation (1 hbp), amputation of the caudal fin and measurement of regrowth. (C) Representative images of caudal fin regeneration at 72 hpA (Scale bar = 100 μm) with the corresponding graph showing the fin length or area at 72 hpA, after amputation and immersion with zebrafish water (CT), 2DG (50 μM), DCA (500 μM), or GAL (500 nM) from 0 to 72 hpA (mean ± SEM, n > 30, ordinary one-way ANOVA, Dunnett's multiple comparisons test, compared to control, *p ≤ 0.05, ***p ≤ 0.001, ****p ≤ 0.0001). (D) Experimental design illustrating the time windows of drug administration and the impact on fin regeneration. (E) Graph showing the fin length at 72 hpA, after amputation and immersion with zebrafish water (CT), 2DG (50 μM), DCA (500 μM), or GAL (500 nM) from 0 to 24 hpA (mean ± SEM, n < 30, Kruskal-Wallis, Dunn's multiple comparisons test, compared to control, *p ≤ 0.05, **p ≤ 0.01). (F) Graph showing the fin length at 72 hpA, after amputation and immersion with zebrafish water (CT), 2DG (50 μM), DCA (500 μM), or GAL (500 nM) from 24 to 72 hpA (mean ± SEM, n < 30, Kruskal-Wallis, Dunn's multiple comparisons test, compared to control, non-significant). |

Exogenous lactate accelerates the caudal fin regeneration after amputation. (A) Graph showing the fin growth length of uncut larvae at 144 hpf when immersed in zebrafish water (CT), or when immersed in lactate (mean ± SEM, n < 30, Mann Whitney test, two-tailed, non-significant). (B) Representative images of caudal fin regeneration at 72 hpA (Scale bar = 100μm) with the corresponding graph (C) showing the fin length after amputation and immersion with zebrafish water (CT), lactate (100 μM) or GAL (500 nM) and lactate (100 μM) added at the same time (mean ± SEM, n < 30, Mann Whitney test, two-tailed, ***p ≤ 0.001). (D) Graph showing the fin area after amputation and immersion with zebrafish water (CT), lactate (100 μM) or GAL (500 nM) and lactate (100 μM) added at the same time at 72 hpA (mean ± SEM, n < 30, Mann Whitney test, two-tailed, ****p ≤ 0.0001). |
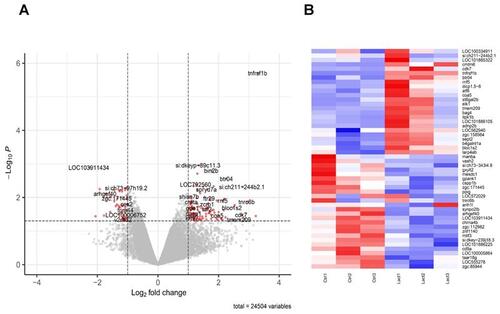
Transcriptomic effect of lactate on macrophages in the regenerating caudal fin. (A) Volcano Plot displaying the differentially expressed genes in macrophages upon lactate treatment (red dots). (B) Heatmap containing the top 25 significantly up-regulated and downregulated genes sorted by their average expression foldchange in macrophages from amputated caudal fins with (Lact) or without (Ctrl) lactate treatment; 3 biological replicates for each condition. |