
Fig. 3
- ID
- ZDB-FIG-220607-17
- Publication
- Bohaud et al., 2022 - Lactate metabolism coordinates macrophage response and regeneration in zebrafish
- Other Figures
- All Figure Page
- Back to All Figure Page
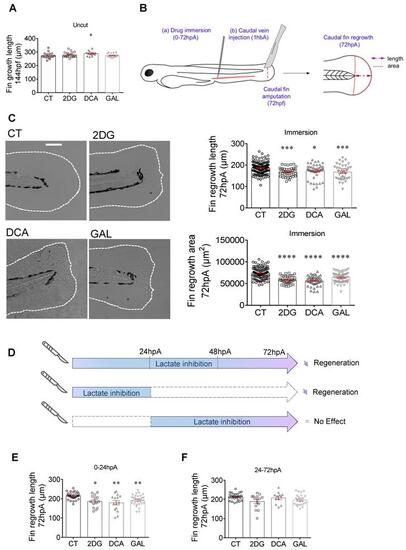
Glycolytic and lactate inhibitors impact on the caudal fin regeneration after amputation. (A) Graph showing the fin growth length of uncut larvae at 144 hpf when immersed in zebrafish water (CT), or when immersed in 2DG (50 μM), DCA (500 μM), or in GAL (500 nM) (mean ± SEM, n < 30, Kruskal-Wallis, Dunn's multiple comparisons test, compared to control, *p ≤ 0.05). (B) Design of the experiment: (a) add drugs in immersion from 0 until 72 hpA, or (b) add drug in caudal vein injection at 1 hour before amputation (1 hbp), amputation of the caudal fin and measurement of regrowth. (C) Representative images of caudal fin regeneration at 72 hpA (Scale bar = 100 μm) with the corresponding graph showing the fin length or area at 72 hpA, after amputation and immersion with zebrafish water (CT), 2DG (50 μM), DCA (500 μM), or GAL (500 nM) from 0 to 72 hpA (mean ± SEM, n > 30, ordinary one-way ANOVA, Dunnett's multiple comparisons test, compared to control, *p ≤ 0.05, ***p ≤ 0.001, ****p ≤ 0.0001). (D) Experimental design illustrating the time windows of drug administration and the impact on fin regeneration. (E) Graph showing the fin length at 72 hpA, after amputation and immersion with zebrafish water (CT), 2DG (50 μM), DCA (500 μM), or GAL (500 nM) from 0 to 24 hpA (mean ± SEM, n < 30, Kruskal-Wallis, Dunn's multiple comparisons test, compared to control, *p ≤ 0.05, **p ≤ 0.01). (F) Graph showing the fin length at 72 hpA, after amputation and immersion with zebrafish water (CT), 2DG (50 μM), DCA (500 μM), or GAL (500 nM) from 24 to 72 hpA (mean ± SEM, n < 30, Kruskal-Wallis, Dunn's multiple comparisons test, compared to control, non-significant). |