
Fig. 1
- ID
- ZDB-FIG-220607-15
- Publication
- Bohaud et al., 2022 - Lactate metabolism coordinates macrophage response and regeneration in zebrafish
- Other Figures
- All Figure Page
- Back to All Figure Page
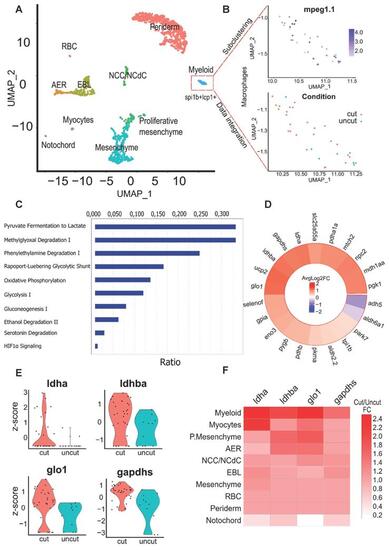
Identification of key pathways modulated within macrophages of the regenerating caudal fin from Single-cell RNAseq data. (A) Clustering of the integrated data from the 24 hpA caudal fin (cut) and their uninjured counterparts (uncut). AER: apical ectodermal ridge, EBL: epithelial basal layers, NCC/NCdC: Neural crest cells/NCC derived cells. (B) Feature plot of macrophages subset based on mpeg1.1 expression and dimensional reduction plot of their distribution through the cut and uncut conditions. (C) Canonical pathway analysis from the Ingenuity Pathway analysis (IPA) of the metabolic network. Ratio (genes detected / total number of genes of the pathway) within macrophages subset. (D) Heatmap of the cut/uncut gene expression ratio of the main glycolysis associated-genes (E) Violin plots of the top differentially expressed glycolytic and lactate-associated genes within cut and uncut conditions. (F) Heatmap of the cut/uncut expression fold change for the top DE genes through the different caudal fin cell populations. |