
|
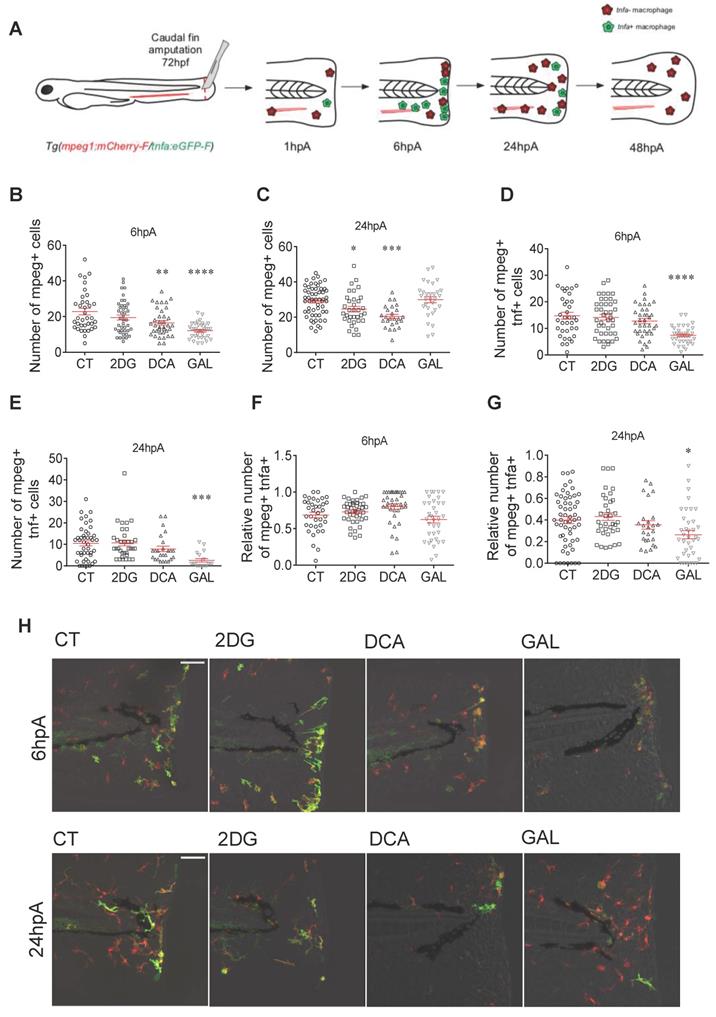
Fig. 2
Glycolytic and lactate inhibitors alter the recruitment and the polarization of macrophages. (A) Experimental design of macrophage recruitment, migration, and polarization after amputation. (B) Graph showing the quantification of the number of mpeg+ macrophages in the entire fin at 6 hpA after amputation and immersion with zebrafish water (CT), 2DG (50 μM), DCA (500 μM), or GAL (500 nM) (mean ± SEM, n > 30, ordinary one-way ANOVA, Dunnett's multiple comparisons test, compared to control, **p ≤ 0.01, ****p ≤ 0.0001). (C) Graph showing the quantification of the number of mpeg+ macrophages in the entire fin at 24 hpA after amputation and immersion with zebrafish water (CT), 2DG (50 μM), DCA (500 μM), or GAL (500 nM) (mean ± SEM, n< 30, Kruskal-Wallis, Dunn's multiple comparisons test, compared to control, *p ≤ 0.05, ***p ≤ 0.001). (D) Graph showing the quantification of the number of mpeg+tnfa+ macrophages in the entire fin at 6 hpA after amputation and immersion with zebrafish water (CT), 2DG (50 μM), DCA (500 μM), or GAL (500 nM) (mean ± SEM, n > 30, ordinary one-way ANOVA, Dunnett's multiple comparisons test, compared to control, ****p ≤ 0.0001). (E) Graph showing the quantification of the number of mpeg+tnfa+ macrophages in the entire fin at 24 hpA after amputation and immersion with zebrafish water (CT), 2DG (50 μM), DCA (500 μM), or GAL (500 nM) (mean ± SEM, n > 30, ordinary one-way ANOVA, Dunnett's multiple comparisons test, compared to control, ***p ≤ 0.001). (F) Graph showing the relative number of mpeg+tnfa+ macrophages (fold change of mpeg+tnfa+ macrophages over the total number of mpeg+ macrophages macrophages) in the entire fin at 6 hpA after amputation and immersion with zebrafish water (CT), 2DG (50 μM), DCA (500 μM), or GAL (500 nM) (mean ± SEM, n > 30, ordinary one-way ANOVA, Dunnett's multiple comparisons test, compared to control, non-significant). (G) Graph showing the relative number of mpeg+tnfa+ macrophages (fold change of mpeg+ tnfa+ macrophages over the total number of mpeg+ macrophages) in the entire fin at 24 hpA after amputation and immersion with zebrafish water (CT), 2DG (50 μM), DCA (500 μM), or GAL (500 nM) (mean ± SEM, n > 30, ordinary one-way ANOVA, Dunnett's multiple comparisons test, compared to control, *p ≤ 0.05). (H) Z projection of confocal images illustrating macrophage recruitment and activation at 6 and 24 hpA after amputation and immersion with zebrafish water (CT), 2DG (50 μM), DCA (500 μM), or GAL (500 nM) (Scale bar = 60 μm).