
Image
|
Figure Caption
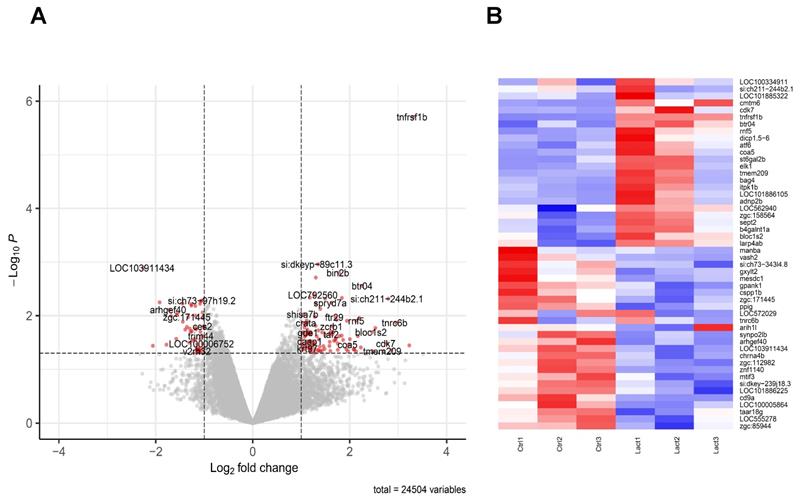
Fig. 5
Transcriptomic effect of lactate on macrophages in the regenerating caudal fin. (A) Volcano Plot displaying the differentially expressed genes in macrophages upon lactate treatment (red dots). (B) Heatmap containing the top 25 significantly up-regulated and downregulated genes sorted by their average expression foldchange in macrophages from amputated caudal fins with (Lact) or without (Ctrl) lactate treatment; 3 biological replicates for each condition.
Acknowledgments
This image is the copyrighted work of the attributed author or publisher, and
ZFIN has permission only to display this image to its users.
Additional permissions should be obtained from the applicable author or publisher of the image.
Full text @ Theranostics