
- Title
-
Airy-like beam-based light-sheet microscopy with improved FOV for zebrafish intracerebral hemorrhage
- Authors
- Liu, P., Chen, H., Pang, M., Liu, X., Wang, J., Zhang, X.D., Ming, D.
- Source
- Full text @ Opt. Express

Fig. 1. Configuration of Airy-like LSFM. |
Fig. 2.
|
Fig. 3.
|
Fig. 4.
|
Fig. 5.
|

Fig. 6.
|
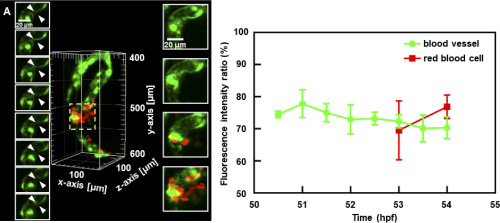
Fig. 7.
|