
Image
|
Figure Caption
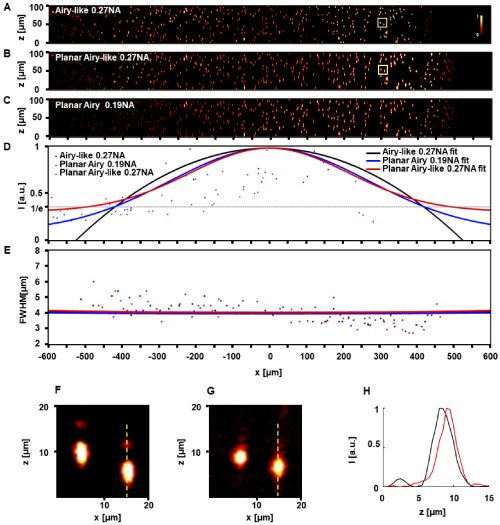
Fig. 5
Fig. 5. Comparison of planar Airy light-sheet and planar Airy-like light-sheet using 2-PE with standard fluorescent microspheres. (A, B, C) Maximum intensity projections of recorded data of fluorescent microspheres. (D) Peak intensity as a function of propagation distance (FOV) for the microspheres illuminated with the 2-PE Airy-like light-sheet (black) and the 2-PE planar Airy-like light-sheet (red). (E) Full-width at half maximum (FWHM) in z axial of the microsphere images. (F, G) Maximum intensity projection of microspheres near the edge of FOV for Airy-like light-sheet in (E) and planar Airy-like light-sheet in (A, B). (H) The intensity profile of the microspheres in panels (E) and (F).
Acknowledgments
This image is the copyrighted work of the attributed author or publisher, and
ZFIN has permission only to display this image to its users.
Additional permissions should be obtained from the applicable author or publisher of the image.
Full text @ Opt. Express