
Image
|
Figure Caption
Fig. 6
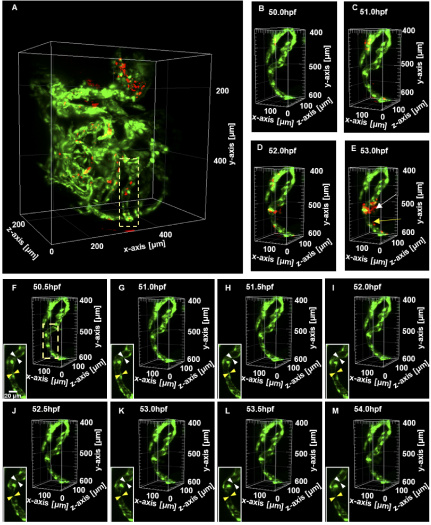
Fig. 6. Real-time monitoring of ICH in zebrafish model. (A) The distribution of cerebral blood vessels (green) and red blood cells (red) in zebrafish larva. (B-E) partial 3D diagrams of blood vessel (PrA), corresponding to the position of the yellow dashed box as shown in panel(A). (F-M) Dynamic change of blood vessels from 50.5 to 54hpf (see Visualization 2 , Visualization 3 , Visualization 4 , and Visualization 5 ).
Acknowledgments
This image is the copyrighted work of the attributed author or publisher, and
ZFIN has permission only to display this image to its users.
Additional permissions should be obtained from the applicable author or publisher of the image.
Full text @ Opt. Express