
Image
|
Figure Caption
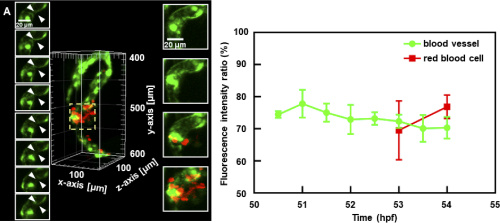
Fig. 7
Fig. 7. Analysis of changes in fluorescence intensity of blood vessels (green) and red blood cells (red) within bleeding area. (A) Analysis of changes in fluorescence intensity of blood vessels in the yellow dashed box, with panels on the left and that of red blood cells on the right. (B) Fluorescence intensity ratio of blood vessels and red blood cells in the three bleeding areas at different time points. The value of the fluorescence ratio is derived from the ratio of the total fluorescence of the sub-area to the total fluorescence of a certain area, and data are shown as mean ± standard deviation.
Acknowledgments
This image is the copyrighted work of the attributed author or publisher, and
ZFIN has permission only to display this image to its users.
Additional permissions should be obtained from the applicable author or publisher of the image.
Full text @ Opt. Express