FIGURE SUMMARY
Title

Invadopodia play a role in prostate cancer progression

Authors
Manuelli, V., Cahill, F., Wylie, H., Gillett, C., Correa, I., Heck, S., Rimmer, A., Haire, A., Van Hemelrijck, M., Rudman, S., Wells, C.M.
Source
Full text @ BMC Cancer

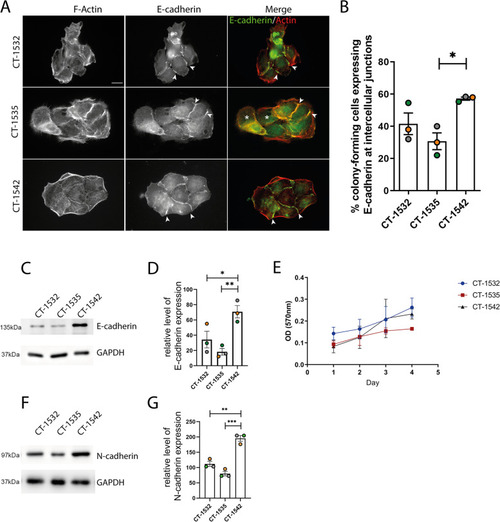
Differential cadherin expression levels. A cancer cell lines stained for E-cadherin (green) and F-actin (red). Scale bar = 10 μm. B Percentage of cells was forming colonies (cells forming adhesions with at least two neighbour cells) exhibiting E-cadherin signal at cell:cell junctions. Note that whilst in the 1542 cell colony all cells form at least one E-cadherin positive junction (arrowheads indicate examples of E-cadherin positive cell: cell junctions) the 1535 cell colony is less compact overall and contains cells that are not forming any E-cadherin positive cell: cell junctions (indicated by *) C Expression level of E-cadherin. D Quantification of E-cadherin expression by densitometric analysis corrected for the loading control (GAPDH) E Cell growth curve repeated over four consecutive days. F Expression level of N-cadherin G Quantification N-cadherin expression by densitometric analysis corrected for the loading control (GAPDH). Membranes were cut prior to hybridisation cropped Figure C and F are taken from three replicate analysis. Statistical significance was calculated with One-way Anova followed by Tukey’s multiple comparisons test, *p < 0.05, **p < 0.01, ***p < 0.005. All data is representative of 3 independent experiments mean ± SEM

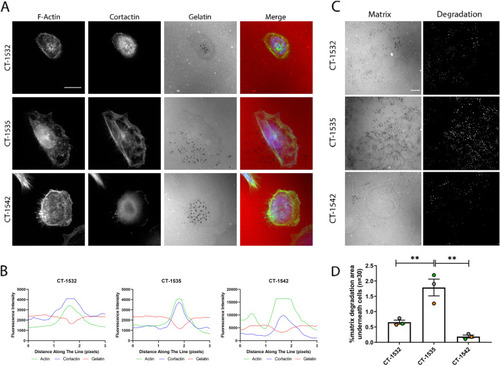
Primary prostate adenocarcinoma cell lines form invadopodia. A Cells were seeded on Cy3-conjugated gelatin for 24 h and stained for F-actin and Cortactin. B co-localisation of cortactin, F-actin and gelatin degradation. C Gelatin degradation. D percentage of degraded area underneath total cell area. n = 90 cells. All Data presented represent 3 independent experiments, mean ± S.E.M. Significance was calculated with One-way Anova followed by Tukey’s multiple comparisons test, **p < 0.005. Scale bar = 10 μm

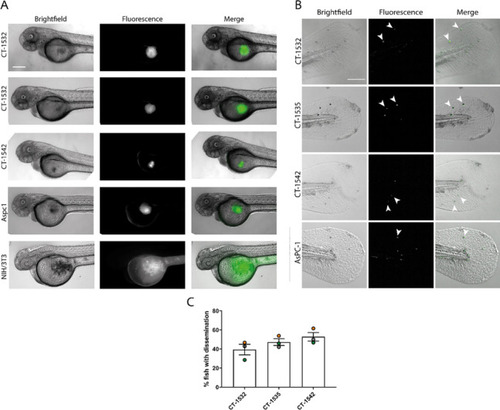
Primary prostate adenocarcinoma cell lines disseminate in-vivo. A xenograft formation in zebrafish yolk-sac invasion assay including an example of a non xenografting cell line NIH 3T3. B metastatic dissemination in the tail 3 days post injection, indicated by arrows. C Quantification of the percentage of embryos exhibiting metastasis in the tail region. Data are representative of three independent experiment, with at least 15 embryos screened for metastasis. Data are presented as mean ± S.E.M. Significance was calculated with One-way Anova followed by Tukey’s multiple comparisons test. Scale bar = 200 µm

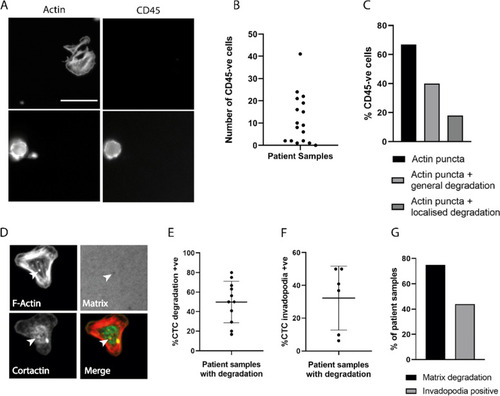
Circulating prostate tumour cells exhibit invadopodia activity. A circulating tumour cells (top) and hematopoietic cells (bottom) stained for CD45 and actin, imaged from the same field of view. B number of CD45-negative cells isolated from each blood sample. C percentage of CD45-negative cells displaying puncta and/or degradation. D PCa CTCs subjected to invadopodia assay and stained for F-Actin and Cortactin after 24 h incubation. Cells exhibited localised matrix degradation overlapping with actin puncta (white arrow) and cortactin puncta co-localising with actin (yellow arrow). E percentage of CTCs exhibiting matrix degradation properties. Samples without any visible degradation underneath CTCs were excluded. F percentage of CTCs exhibiting invadopodia formation in samples found positive for matrix degradation. Samples without any visible invadopodia activity were excluded. G percentage of samples with matrix degradation and invadopodia. Data are presented as Mean ± SD. Scale bar = 10 µm

Acknowledgments
This image is the copyrighted work of the attributed author or publisher, and ZFIN has permission only to display this image to its users. Additional permissions should be obtained from the applicable author or publisher of the image. Full text @ BMC Cancer