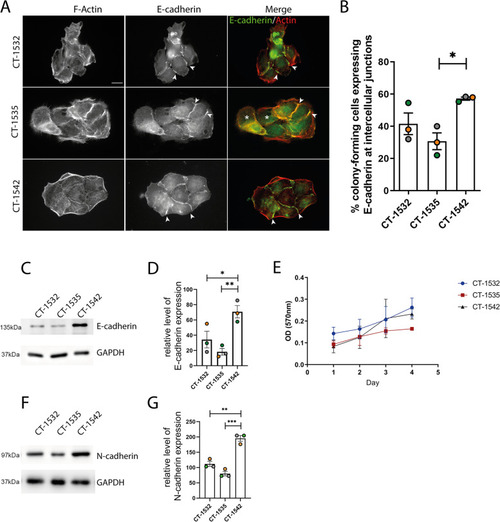
Differential cadherin expression levels. A cancer cell lines stained for E-cadherin (green) and F-actin (red). Scale bar = 10 μm. B Percentage of cells was forming colonies (cells forming adhesions with at least two neighbour cells) exhibiting E-cadherin signal at cell:cell junctions. Note that whilst in the 1542 cell colony all cells form at least one E-cadherin positive junction (arrowheads indicate examples of E-cadherin positive cell: cell junctions) the 1535 cell colony is less compact overall and contains cells that are not forming any E-cadherin positive cell: cell junctions (indicated by *) C Expression level of E-cadherin. D Quantification of E-cadherin expression by densitometric analysis corrected for the loading control (GAPDH) E Cell growth curve repeated over four consecutive days. F Expression level of N-cadherin G Quantification N-cadherin expression by densitometric analysis corrected for the loading control (GAPDH). Membranes were cut prior to hybridisation cropped Figure C and F are taken from three replicate analysis. Statistical significance was calculated with One-way Anova followed by Tukey’s multiple comparisons test, *p < 0.05, **p < 0.01, ***p < 0.005. All data is representative of 3 independent experiments mean ± SEM
|
