
Fig. 4
- ID
- ZDB-FIG-220415-4
- Publication
- Manuelli et al., 2022 - Invadopodia play a role in prostate cancer progression
- Other Figures
- All Figure Page
- Back to All Figure Page
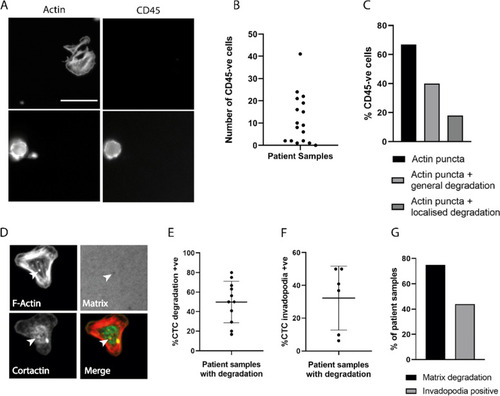
Circulating prostate tumour cells exhibit invadopodia activity. A circulating tumour cells (top) and hematopoietic cells (bottom) stained for CD45 and actin, imaged from the same field of view. B number of CD45-negative cells isolated from each blood sample. C percentage of CD45-negative cells displaying puncta and/or degradation. D PCa CTCs subjected to invadopodia assay and stained for F-Actin and Cortactin after 24 h incubation. Cells exhibited localised matrix degradation overlapping with actin puncta (white arrow) and cortactin puncta co-localising with actin (yellow arrow). E percentage of CTCs exhibiting matrix degradation properties. Samples without any visible degradation underneath CTCs were excluded. F percentage of CTCs exhibiting invadopodia formation in samples found positive for matrix degradation. Samples without any visible invadopodia activity were excluded. G percentage of samples with matrix degradation and invadopodia. Data are presented as Mean ± SD. Scale bar = 10 µm |