
- Title
-
LAPTM4B-35 promotes cancer cell migration via stimulating integrin beta1 recycling and focal adhesion dynamics
- Authors
- Liu, M., Yan, R., Wang, J., Yao, Z., Fan, X., Zhou, K.
- Source
- Full text @ Cancer Sci.
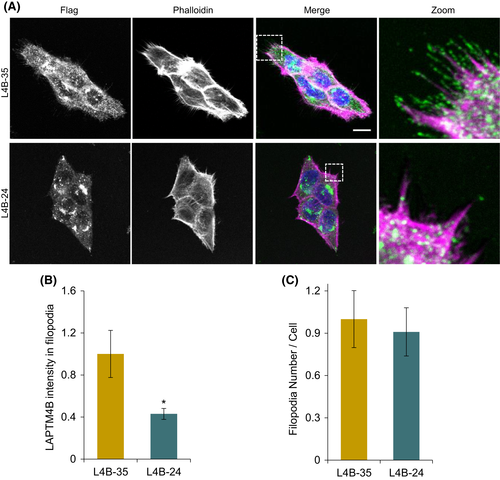
LAPTM4B-35 localized on filopodia. (A), LAPTM4B KO cells stably expressing LAPTM4B-35-Flag (designated name in this study: L4B-35) or LAPTM4B-24-Flag (designated name in this study: L4B-24) were labeled with anti-Flag antibody (green), phalloidin-568 (magenta), and DAPI (blue). Scale bar: 10 �m. (B), Quantification of LAPTM4B immunofluorescence intensity in phalloidin-positive filopodia. Quantification of three experiments (LAPTM4B-35: n = 41 cells; LAPTM4B-24: n = 43 cells), mean � SEM, data normalized to ?L4B-35,? p = 0.015. (C), Number of filopodia in cells stably expressing Flag-tagged LAPTM4B-35 or LAPTM4B-24 on a LAPTM4B KO background. Quantification of three experiments (LAPTM4B-35: n = 41 cells; LAPTM4B-24: n = 43 cells), mean � SEM, data normalized to ?L4B-35?
|
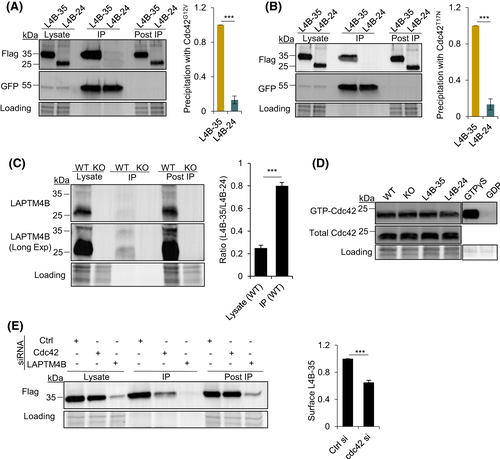
Cdc42 required for LAPTM4B-35 surface localization. (A), LAPTM4B KO cells stably expressing Flag-tagged LAPTM4B-35 or LAPTM4B-24 were transfected with constitutively active Cdc42G12V-GFP. The Cdc42G12V-GFP was pulled down using GFP-trap, with coimmunoprecipitated LAPTM4B, and then detected by Western blotting. The blot was reprobed with GFP antibody. Left panel: representative experiment. Right panel: quantification of n = 3 experiments, mean � SEM, data normalized to ?L4B-35,? p = 9.87 � 10?5. ?Lysate? denotes total cell lysate, ?IP? the immunoprecipitated protein, and ?post IP? the remaining supernatant after immunoprecipitation. (B), Cells stably expressing LAPTM4B-35 and LAPTM4B-24were transfected with the dominant negative CdcT17N-GFP. The Cdc42T17N-GFP was pulled down using GFP-trap, and its interaction with the LAPTM4B isoforms was assessed by Western blotting. Left panel: a representative experiment. Right panel: quantification of three experiments, mean � SEM, data normalized to ?L4B-35.? p = 0.0003. (C), Coimmunoprecipitation of endogenous LAPTM4B with CdcG12V-GFP from WT A431 cells. LAPTM4B KO cells served as a control for antibody specificity. The Cdc42-GFP was pulled down using GFP-trap, and the interaction was further assessed by Western blotting using anti-LAPTM4B antibody. Left panel: a representative experiment. Right panel: quantification of three experiments, mean � SEM, p = 5.09 � 10?5. D, Whole-cell lysates were assessed for active Cdc42. Lysates treated with GTP?S or with GDP served as the positive and negative control. E, Plasma-membrane expression of LAPTM4B-35 was assessed by surface biotinylation in cells stably expressing LAPTM4B-35-Flag, treated with control, Cdc42, or LAPTM4B siRNAs, followed by Western blotting using anti-Flag antibody. Left panel: representative experiment. Right panel: quantification of three experiments, mean � SEM, data normalized to ?Ctrl siRNA,? p = 0.0009
|
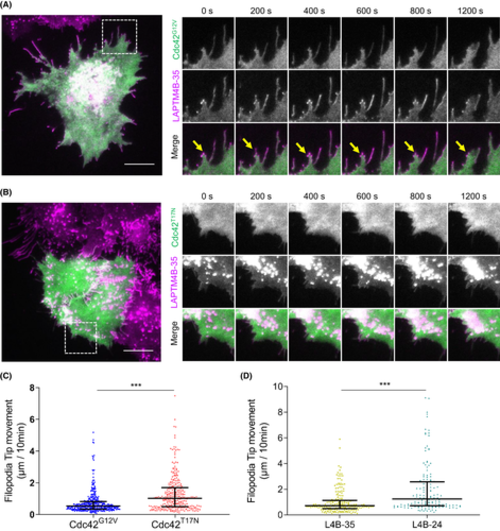
LAPTM4B-35 distributing on Cdc42-induced filopodia. A, A431 cells stably expressing LAPTM4B-35-mCherry were transiently transfected with constitutively active Cdc42G12V-GFP and imaged by live total internal reflection fluorescence (TIRF) microscopy. Scale bar: 10 ?m. A magnified region of interest at different time points is visible on the right. Yellow arrows highlight LAPTM4B-35 positive filopodia. B, A431 cells stably expressing LAPTM4B-35-mCherry were transiently transfected with dominant negative Cdc42T17N-GFP, and imaged by TIRF microscopy. Scale bar: 10 ?m. A region of interest at different time points is on the right. C, A431 cells stably expressing LAPTM4B-35-mCherry were transiently transfected with either constitutively active Cdc42G12V-GFP or dominant negative Cdc42T17N-GFP and imaged by TIRF microscopy. The distance of filopodia tip movement in 10 min was quantified. Each dot represents a single measurement, middle line represents mean, and whiskers represent interquartile range. D, Cells stably expressing Flag-tagged LAPTM4B-35 and LAPTM4B-24 were transfected with integrin beta1-mCherry to visualize cell protrusions, and cells were imaged by live TIRF microscopy. The distance of filopodia tip movement in 10 min was quantified. Data are from three independent experiments and >10 videos per condition. LAPTM4B-35: n = 196 filopodia; LAPTM4B-24: n = 151 filopodia; p = 8.8 � 10?8. Each dot represents a single measurement, middle line represents mean, and whiskers represent interquartile range
|
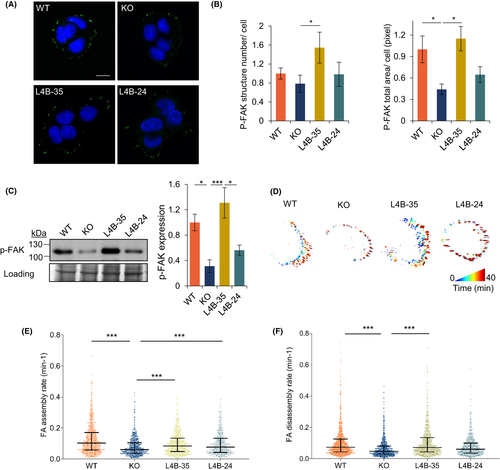
LAPTM4B-35 stimulating focal adhesion formation and dynamics. A, Immunofluorescence staining of p-FAK?positive focal adhesions in A431 WT, LAPTM4B KO, and cells expressing LAPTM4B-24 or LAPTM4B-35 on the KO background. Scale bar: 10 ?m. B, Quantification of the number (left panel, p[KO, L4B-35] = 0.022) and area (right panel, p[WT, KO] = 0.017, p[KO, L4B-35] = 0.016) of p-FAK?positive structures in WT, LAPTM4B KO, LAPTM4B-24, and LAPTM4B-35 cells. Data from three independent experiments, WT: n = 40 cells, KO: n = 38 cells; LAPTM4B-35: n = 40 cells; LAPTM4B-24: n = 44 cells. Mean � SEM, data normalized to ?WT.? C, Western blotting shows total cellular p-FAK expression in A431 WT, LAPTM4B KO, and KO cells with reintroduction of the indicated LAPTM4B isoforms. Left panel: a representative experiment. Right panel: quantification of three experiments, mean � SEM, p(WT, KO) = 0.032, p(KO, LAPTM4B-35) = 0.008, p(LAPTM4B-35, LAPTM4B-24) = 0.027. D, WT, LAPTM4B KO, or A431 cells stably expressing LAPTM4B-24 or LAPTM4B-35 were transfected with paxillin-GFP to label focal adhesions. Paxillin-GFP dynamics were assessed by total internal reflection fluorescence (TIRF) microscopy and subjected to automated quantification. A representative visualization of focal adhesion dynamics over 40 min is shown (blue indicates the start point of imaging, while red indicates the end point of imaging). E, Focal adhesion (FA) assembly rate (min?1) in the indicated cell lines treated as in (D). p(WT, KO) = 4.5 � 10?30, p(KO, LAPTM4B-35) = 1.29 � 10?8, p(KO, LAPTM4B-24) = 2.85 � 10?5. The data are from five independent experiments, and >18 videos per condition. Number of adhesions analyzed; WT: n = 858, KO: n = 646; LAPTM4B-35: n = 752; LAPTM4B-24: n = 504. Each dot represents a single measurement, middle line represents mean, and whiskers represent interquartile range. F, Focal adhesion (FA) disassembly rate (min?1) in WT, LAPTM4B-KO, LAPTM4B-24, and LAPTM4B-35 cell lines. p(WT, KO) = 2.4 � 10?21, p(KO, LAPTM4B-35) = 1.6 � 10?20. The data are from five independent experiments and >18 videos per condition. Number of adhesions analyzed, WT: n = 1025; KO: n = 732; LAPTM4B-35: n = 859; LAPTM4B-24: n = 628
|
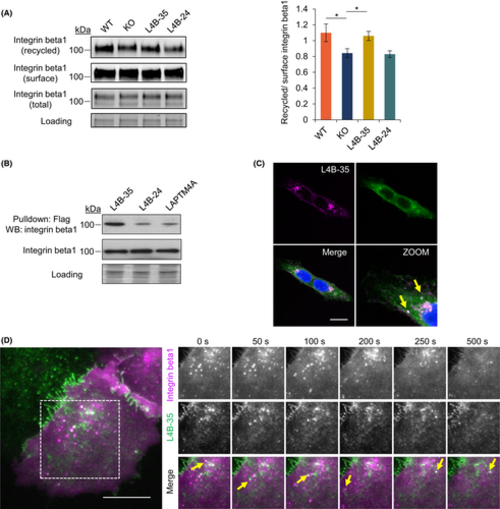
LAPTM4B-35 promoting recycling of integrin beta1. A, Western blotting shows recycled integrin beta1 to be reduced in KO cells and rescuable by LAPTM4B-35 expression. Left panel: a representative experiment. Right panel: quantification of three experiments, mean � SEM, p(WT, KO) = 0.044, p(KO, LAPTM4B-35) = 0.024. B, LAPTM4B KO cells stably expressing LAPTM4B-35-Flag or LAPTM4B-24-Flag, together with A431-expressing LAPTM4A-Flag cells, were pulled down via anti-Flag antibody; coimmunoprecipitated integrin beta1 detected by Western blotting. C, A431 cells stably expressing LAPTM4B-35-mCherry were stained with anti-integrin beta1(N29) antibody. Confocal microscopy revealed the colocalizations to be on the endosome. Scale bar: 10 ?m. Yellow arrows highlight the colocalization. D, A431 cells stably expressing LAPTM4B-35-GFP were transiently transfected with integrin beta1-mCherry and imaged by live TIRF microscopy. Scale bar: 10 ?m. A magnified region of interest at different time points is displayed on the right. Yellow arrows highlight the colocalization
|
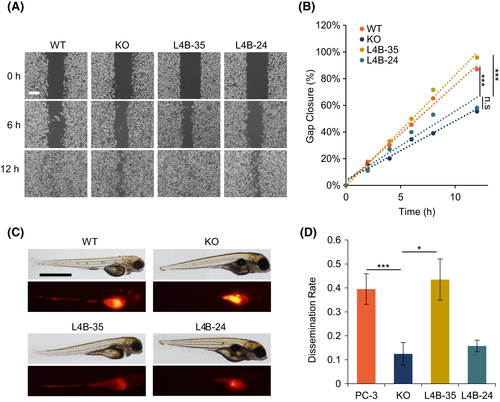
LAPTM4B-35 promoting cancer cell dissemination. A, WT, LAPTM4B KO, and LAPTM4B-24? or LAPTM4B-35?stably expressing PC-3 cells were subjected to a wound-healing assay. Images are representative of five independent experiments at indicated time points. Scale bar: 200 ?m. B, Quantification of wound closure of cells treated as in (A). Values represent the average of five experiments, showing percentage of gap closure at indicated times. C, WT, LAPTM4B KO, and LAPTM4B-24? or LAPTM4B-35?stably expressing PC-3 cells were labeled with Celltracker CM-Dil and injected into the perivitelline cavity of WT zebrafish embryos 48 h post fertilization; 36 h post injection, zebrafish were anesthetized and imaged. Cells dissemination from the perivitelline cavity throughout the fish body underwent assessment. Scale bar: 1 mm. D, Metastasis rate of PC-3 cells in zebrafish (fish number with metastases/total fish number). Five independent experiments (PC-3: n = 43; KO: n = 48; LAPTM4B-35: n = 46; LAPTM4B-24: n = 57), p(PC-3, KO) = 0.003, p(KO, LAPTM4B-35) = 0.014
|
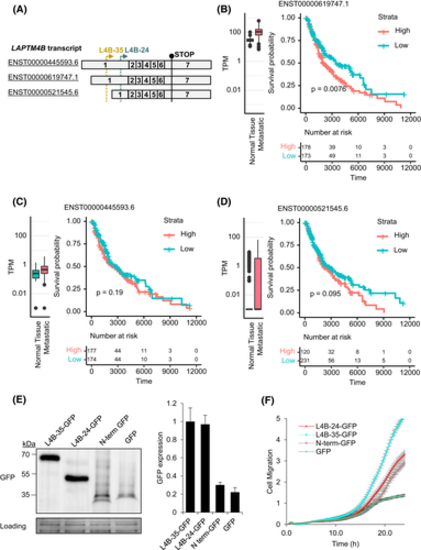
LAPTM4B expression correlates with survival probability in skin cancer metastatic patients. A, Schematic overview of the LAPTM4B transcripts. B-D, Expression of the indicated LAPTM4B transcripts in healthy and tumor samples, and their correlation with cancer overall survival. Left panels: expression of the transcript as transcripts per million (TPM) in normal skin (GTEx) and skin cancer metastatic tissues (TCGA), log10 scale. Right panels: skin cancer metastatic patient survival probability with patients grouped to either high- (>median) or low-expression groups. Bottom panels: number of patients at risk, in either stratum, at a given timepoint (unit: day). E, Stable cells expressing LAPTM4B-35-GFP, LAPTM4B-24-GFP, N-terminus-GFP, or GFP; expression in the cell lysates assessed by Western blotting. Left panel: a representative experiment. Right panel: quantification of three experiments, mean � SEM. F, Real-time measurement of cell migration in cells stably expressing LAPTM4B-35-GFP, LAPTM4B-24-GFP, N-terminus-GFP, or GFP using the xCELLigence system. Those 6 � 104 cells in serum-free medium were seeded in the top chamber; complete medium containing 10% FBS in the lower chamber served as a chemoattractant. Cell migration index measured at an interval of 15 min for 25 h. In five independent experiments, more than 15 wells for each condition were analyzed; mean � SEM
|