
FIGURE
Fig. 4
- ID
- ZDB-FIG-220621-14
- Publication
- Liu et al., 2022 - LAPTM4B-35 promotes cancer cell migration via stimulating integrin beta1 recycling and focal adhesion dynamics
- Other Figures
- All Figure Page
- Back to All Figure Page
Fig. 4
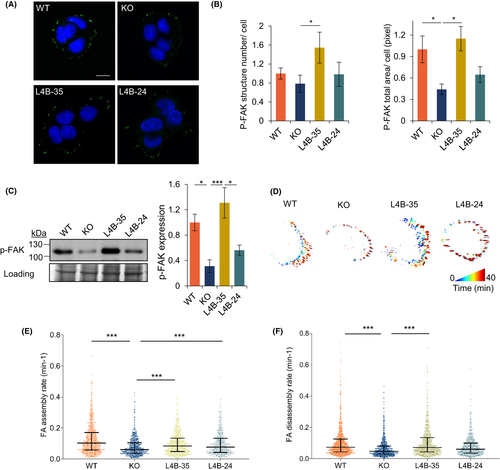
LAPTM4B-35 stimulating focal adhesion formation and dynamics. A, Immunofluorescence staining of p-FAK–positive focal adhesions in A431 WT, LAPTM4B KO, and cells expressing LAPTM4B-24 or LAPTM4B-35 on the KO background. Scale bar: 10 μm. B, Quantification of the number (left panel, p[KO, L4B-35] = 0.022) and area (right panel, p[WT, KO] = 0.017, p[KO, L4B-35] = 0.016) of p-FAK–positive structures in WT, LAPTM4B KO, LAPTM4B-24, and LAPTM4B-35 cells. Data from three independent experiments, WT: n = 40 cells, KO: n = 38 cells; LAPTM4B-35: n = 40 cells; LAPTM4B-24: n = 44 cells. Mean ± SEM, data normalized to “WT.” C, Western blotting shows total cellular p-FAK expression in A431 WT, LAPTM4B KO, and KO cells with reintroduction of the indicated LAPTM4B isoforms. Left panel: a representative experiment. Right panel: quantification of three experiments, mean ± SEM, p(WT, KO) = 0.032, p(KO, LAPTM4B-35) = 0.008, p(LAPTM4B-35, LAPTM4B-24) = 0.027. D, WT, LAPTM4B KO, or A431 cells stably expressing LAPTM4B-24 or LAPTM4B-35 were transfected with paxillin-GFP to label focal adhesions. Paxillin-GFP dynamics were assessed by total internal reflection fluorescence (TIRF) microscopy and subjected to automated quantification. A representative visualization of focal adhesion dynamics over 40 min is shown (blue indicates the start point of imaging, while red indicates the end point of imaging). E, Focal adhesion (FA) assembly rate (min−1) in the indicated cell lines treated as in (D). p(WT, KO) = 4.5 × 10⁻³⁰, p(KO, LAPTM4B-35) = 1.29 × 10⁻⁸, p(KO, LAPTM4B-24) = 2.85 × 10⁻⁵. The data are from five independent experiments, and >18 videos per condition. Number of adhesions analyzed; WT: n = 858, KO: n = 646; LAPTM4B-35: n = 752; LAPTM4B-24: n = 504. Each dot represents a single measurement, middle line represents mean, and whiskers represent interquartile range. F, Focal adhesion (FA) disassembly rate (min−1) in WT, LAPTM4B-KO, LAPTM4B-24, and LAPTM4B-35 cell lines. p(WT, KO) = 2.4 × 10⁻²¹, p(KO, LAPTM4B-35) = 1.6 × 10⁻²⁰. The data are from five independent experiments and >18 videos per condition. Number of adhesions analyzed, WT: n = 1025; KO: n = 732; LAPTM4B-35: n = 859; LAPTM4B-24: n = 628
|
Expression Data
Expression Detail
Antibody Labeling
Phenotype Data
Phenotype Detail
Acknowledgments
This image is the copyrighted work of the attributed author or publisher, and
ZFIN has permission only to display this image to its users.
Additional permissions should be obtained from the applicable author or publisher of the image.
Full text @ Cancer Sci.