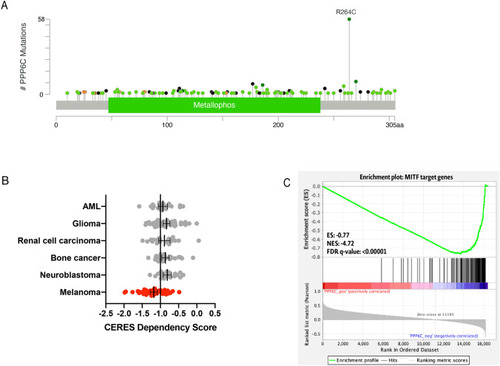
PPP6C is recurrently mutated in melanoma and has a unique relationship to melanocyte lineage and MITF. (A) Lollipop plot showing the distribution of PPP6C mutations across the coding protein. The y-axis represents the number of mutations. Data represents PPP6C mutations found in 184 pan-cancer studies. 57/58 tumors containing a PPP6C(R264C) mutation were melanomas. (B) Dependency scores derived from CRISPR loss of function screens across multiple cancer and primary cell lines. A gene with a score of less than − 1 is considered essential in that cellular context. (C) Gene set enrichment analysis of the transcriptomes of 42 publicly available melanoma cell lines. Plot represents MITF target gene enrichment across increasing PPP6C expression.

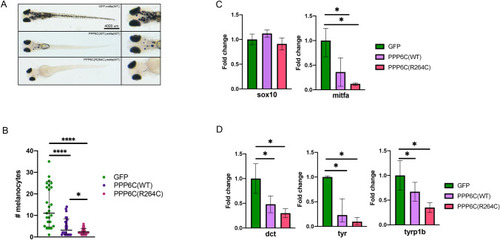
PPP6C disrupts melanocyte differentiation in vivo. (A) Representative images of 5 day old fish on the roy;nacre background injected with either MC-GFP, MC-PPP6C, or MC-PPP6C(R264C). (B) Representative counts of melanocytes of 5 day old fish on the roy;nacre background injected with either MC-GFP, MC-PPP6C, or MC-PPP6C(R264C) (Student’s two-tailed t-test). (C) Real-time qPCR measurement of SOX10 and MITF in 48 h post fertilization fish injected with either MC-GFP, MC-PPP6C or MC-PPP6C(R264C) (Student’s two-tailed t-test). (D) Real-time qPCR measurement of DCT, TYR, and TYRP1B in 48 h post fertilization fish injected with either MC-GFP, MC-PPP6C or MC-PPP6C(R264C) (Student’s two-tailed t-test). All data panels in the figure are representative of at least three experiments. p-values are indicated as following: *p < 0.05, ****p ≤ 0.0001.

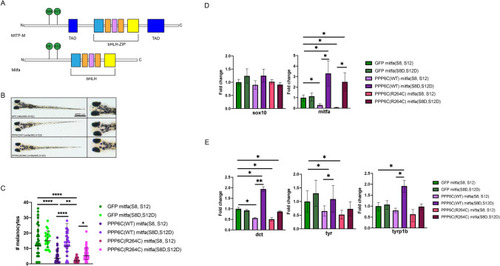
MITF mutation prevents PPP6C-mediated melanocyte differentiation disruption. (A) Schematic of the human MITF-M and zebrafish Mitfa proteins. (B) Representative images of 5 day old fish on the roy;nacre background injected with either MC-GFP;mitfa(S8D,S12D), MC-PPP6C;mitfa(S8D,S12D), or MC-PPP6C(R264C);mitfa(S8D,S12D). (C) Representative counts of melanocytes of 5 day old fish on the roy;nacre background injected with either MC-GFP, MC-PPP6C, or MC-PPP6C(R264C) and with either MITF(S8,S12) or the MITF(S8D, S12D) mutations (Student’s two-tailed t-test). (D) Real-time qPCR measurement of SOX10 and MITF in 48 h post fertilization fish injected with either MC-GFP, MC-PPP6C or MC-PPP6C(R264C) and with either MITF(S8,S12) or the MITF(S8D, S12D) mutations (Student’s two-tailed t-test). (E) Real-time qPCR measurement of DCT, TYR, and TYRP1B in 48 h post fertilization fish injected with either MC-GFP, MC-PPP6C or MC-PPP6C(R264C) with and with either MITF(S8,S12) or the MITF(S8D, S12D) mutations. All data panels in the figure are representative of at least three experiments. p-values are indicated as following: *p < 0.05, **p ≤ 0.01, ****p ≤ 0.0001.

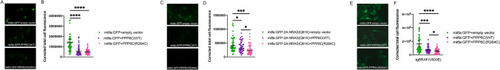
MITF promoter activity is reduced under expression of PPP6C(WT) and PPP6C(R264C) on multiple oncogenic backgrounds. (A, C, E) Representative confocal imaging of fluorescent pigment less melanocytes of tgBRAF(V600E); nacre;p53(M214K);albino, roy;nacre, or roy;nacre;p53(M214K) fish injected with a GFP reporter under control of the mitfa promoter. (B, D, F) Representative quantification of fluorescence for each genotype. Fish were imaged under a confocal microscope and total fluorescence was quantified for 10 melanocytes on N = 5 fish of each genotype. All data panels in the figure are representative of at least three experiments (Student’s two-tailed t-test). p-values are indicated as following: *p < 0.05, ***p ≤ 0.001, ****p ≤ 0.0001.

The recurrent PPP6C(R264C) mutation confers a gain of function proliferation phenotype in melanoma. (A) Representative images of fish injected with either PPP6C(WT)-2A-NRAS(Q61K) or PPP6C(R264C)-2A-NRAS(Q61K) at 3- and 5-days post fertilization. (B) Quantification of proliferation as measured by the change in number of melanocytes from 72 to 120 h post fertilization, N = 15 fish (Student’s two-tailed t-test). (C) Representative melanoma-free survival curve comparing tumors expressing PPP6C(R264C) to PPP6C(WT). One of two independent experiments is shown (log-rank (mantel-cox) test). p-values are indicated as following: *p < 0.05, **p ≤ 0.01.

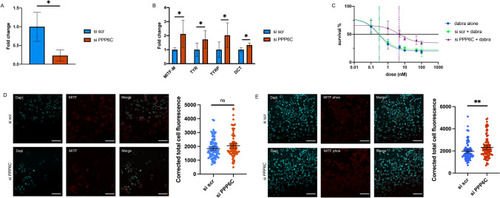
PPP6C expression affects MITF expression and drug resistance in melanoma. (A) Real-time PCR measurement of PPP6C in cells 72 h after transfection with either siPPP6C or siNon-targeting (Student’s two-tailed t-test). (B) Real-time PCR measurement of MITF and three target genes in cells with and without PPP6C knockdown 72 h after transfection (Student’s two-tailed t-test). (C) Drug dose response curve for A375 cells treated with dabrafenib and knockdown of PPP6C 72 h after transfection and treatment. Dotted lines display EC 50 for each condition. (D) Cellular expression of total MITF in A375 cells. Representative confocal images of fluorescence 72 h after transfection with either siPPP6C or siNon-targeting and staining with a MITF antibody, with quantification of fluorescence for each condition. One of two independent experiments is shown (Student’s two-tailed t-test). (E) Cellular expression of phospho-MITF in A375 cells. Representative confocal images of fluorescence 72 h after transfection with either siPPP6C or siNon-targeting and staining with a phospho-specific MITF antibody, with quantification of fluorescence for each condition. One of two independent experiments is shown (Student’s two-tailed t-test). p-values are indicated as following: *p < 0.05, **p ≤ 0.01. NS: non-significant p-value.

Acknowledgments
This image is the copyrighted work of the attributed author or publisher, and ZFIN has permission only to display this image to its users. Additional permissions should be obtained from the applicable author or publisher of the image. Full text @ Sci. Rep.