
- Title
-
Induction of Liver Size Reduction in Zebrafish Larvae by the Emerging Synthetic Cannabinoid 4F-MDMB-BINACA and Its Impact on Drug Metabolism
- Authors
- Park, Y.M., Dahlem, C., Meyer, M.R., Kiemer, A.K., Müller, R., Herrmann, J.
- Source
- Full text @ Molecules
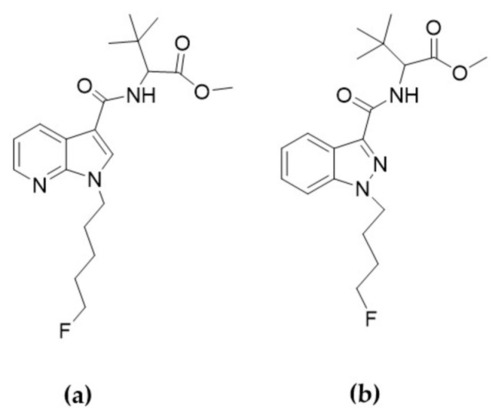
Chemical structures of 7′N-5F-ADB (a) and 4F-MDMB-BINACA (b). |
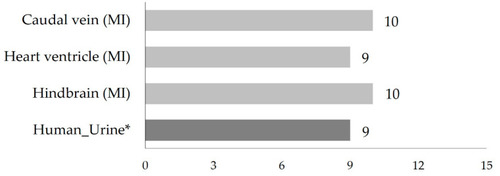
Total number of detected 4F-MDMB-BINACA metabolites following administration of the SC into ZF larvae through different microinjection routes. All results from ZF larvae in this study are represented as the mean value of peak numbers from triplicates of 30 pooled larvae. * Human urine data represent published integrated data of metabolites that were detected at least twice in all studied urine samples [27,32,34,35]. (MI: microinjection). |
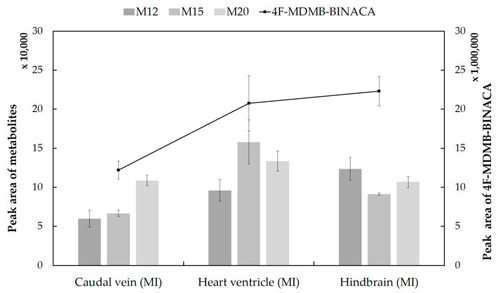
Detection profiles of the parent compound 4F-MDMB-BINACA and the three most abundant metabolites in microinjected ZF larvae (caudal vein, heart ventricle, and hindbrain). The most abundant metabolites (M12, M15, and M20) were formed by lactone formation, oxidative defluorination, and hydroxylation, respectively. The line chart represents the relative abundance of the parent compound, and three gray-colored clustered columns stand for its major metabolites. All data are displayed as mean ± standard deviation (SD) (n = 3). |
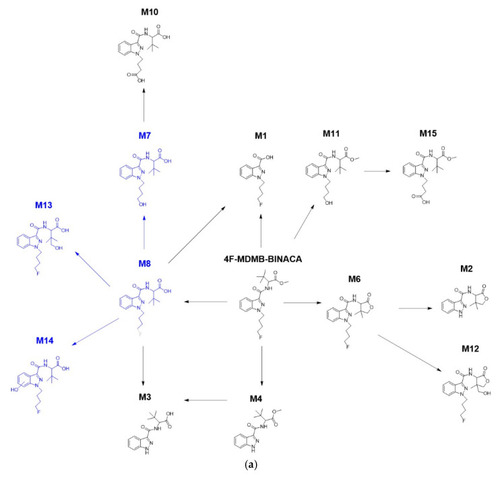
The main phase I metabolic pathway of 4F-MDMB-BINACA based on findings in the ZF larvae model (a) and from human screening (b). In panel (b), red arrows indicate results from human blood samples, and blue arrows indicate results from human urine samples. Metabolites in blue represent molecules not detected in the respective model. Four metabolites (M7, M8, M13, and M14) were not detected in the microinjected ZF larvae despite the detection of M3 and M10 as their following sequential metabolites. In contrast, terminal metabolites M1, M2, and M12 and a cross-connection between M3 and M4 were not found in human samples. |
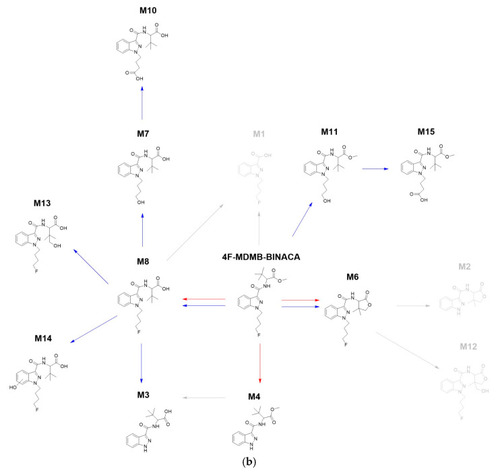
The main phase I metabolic pathway of 4F-MDMB-BINACA based on findings in the ZF larvae model (a) and from human screening (b). In panel (b), red arrows indicate results from human blood samples, and blue arrows indicate results from human urine samples. Metabolites in blue represent molecules not detected in the respective model. Four metabolites (M7, M8, M13, and M14) were not detected in the microinjected ZF larvae despite the detection of M3 and M10 as their following sequential metabolites. In contrast, terminal metabolites M1, M2, and M12 and a cross-connection between M3 and M4 were not found in human samples. |
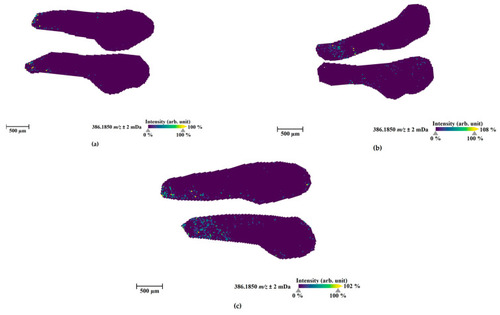
MALDI-MS images of the parent compound (4F-MDMB-BINACA, sodium adduct, m/z 386.1850) in zebrafish larvae at 4 days post-fertilization (dpf) exposed for 1 h at 28 °C through direct administration routes via microinjection into the caudal vein (a), heart ventricle (b), and hindbrain (c). The presented sections originate from one representative larva per condition. The images were generated by preparing a colormap from blue (no detection) to yellow (high local concentration), and images were further processed in 96 dpi resolution with 24 bit color under no denoising state. Each panel shows two different slices of the same specimen. |
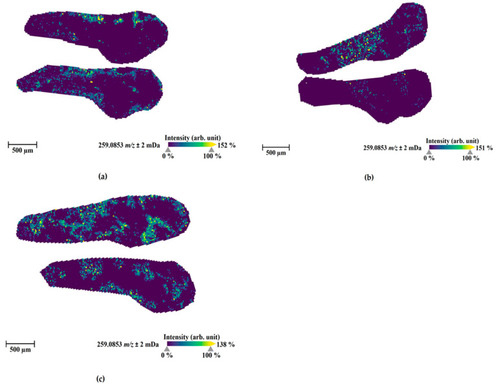
MALDI-MS images of the most abundant metabolite M1 (amide hydrolysis form, sodium adduct, m/z 259.0853) in zebrafish larvae at 4 days post-fertilization (dpf) exposed by 4F-MDMB-BINACA for 1 h at 28 °C through direct administration routes via microinjection into the caudal vein (a), heart ventricle (b), and hindbrain (c). The presented sections originated from one representative larva per condition. The images were generated by preparing a colormap from blue (no detection) to yellow (high local concentration), and images were further processed in 96 dpi resolution with 24 bit color under no denoising state. Each panel shows two different slices of the same specimen. |

Liver size assessment (a) and red fluorescent liver morphologies (b) of transgenic ZF larvae (Tg(fabp10a:DsRed;elaA:EGFP)) treated by waterborne exposure with DMSO, 7′N-5F-ADB (50 µM), or 4F-MDMB-BINACA (25 µM) from 4 dpf to 5 dpf (n = 11–15). All data are represented by the mean ± standard error of the mean (s.e.m.) and p values were computed by one-way ANOVA (** p < 0.01, *** p < 0.001). Liver sizes were determined based on fluorescence microscopy images using ImageJ 1.53a. Scale bars: 500 µm. |
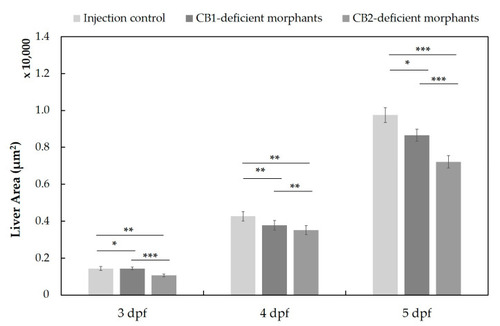
Liver size assessment in the transgenic ZF line (Tg(fabp10a:DsRed;elaA:EGFP)) after MO injection at one-cell stage to generate CB1- and CB2-deficient morphants (n = 43 (at 3 dpf), 41 (at 4 dpf), 55 (at 5 dpf)). All data are represented by the mean ± standard error of the mean (s.e.m.), and p values were computed with one-way ANOVA (* p < 0.05, ** p < 0.01, *** p < 0.001). Liver sizes were determined based on fluorescence microscopy images using ImageJ 1.53a. |
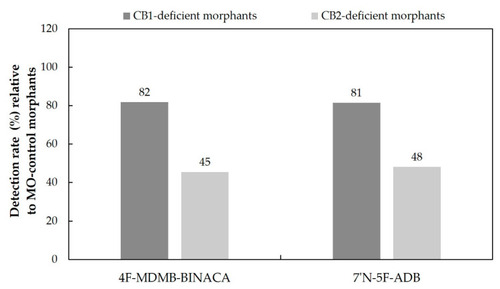
Comparison of the overall detection rates of phase I and phase II metabolites produced in CB1-deficient and CB2-deficient ZF larvae after waterborne exposure to 25 µM 4F-MDMB-BINACA and 50 µM 7′N-5F-ADB, respectively (n = 3). The detection rates were calculated based on the number of metabolites found in the respective control population (set to 100%). |