
Image
|
Figure Caption
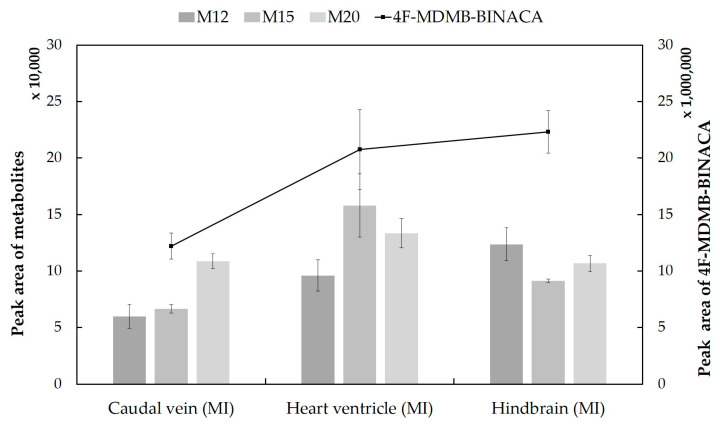
Figure 3
Detection profiles of the parent compound 4F-MDMB-BINACA and the three most abundant metabolites in microinjected ZF larvae (caudal vein, heart ventricle, and hindbrain). The most abundant metabolites (M12, M15, and M20) were formed by lactone formation, oxidative defluorination, and hydroxylation, respectively. The line chart represents the relative abundance of the parent compound, and three gray-colored clustered columns stand for its major metabolites. All data are displayed as mean ± standard deviation (SD) (n = 3).
Acknowledgments
This image is the copyrighted work of the attributed author or publisher, and
ZFIN has permission only to display this image to its users.
Additional permissions should be obtained from the applicable author or publisher of the image.
Full text @ Molecules