
|
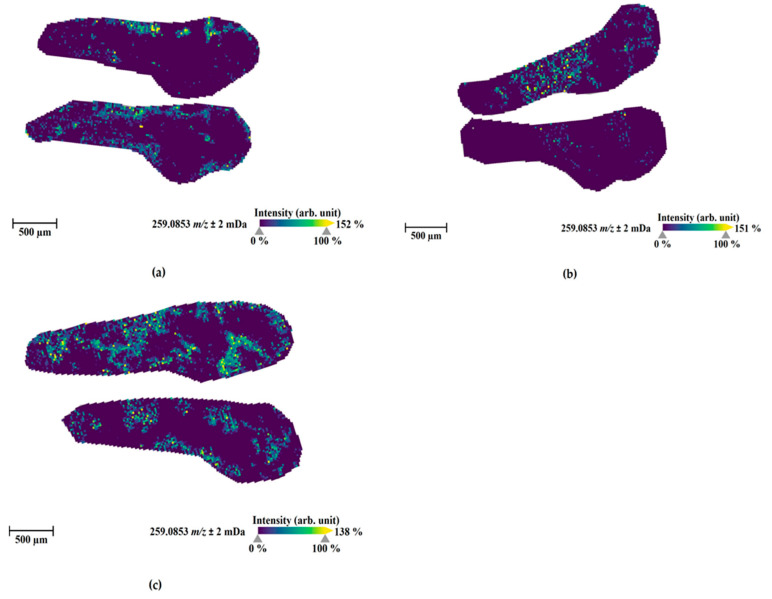
Figure 6
MALDI-MS images of the most abundant metabolite M1 (amide hydrolysis form, sodium adduct, m/z 259.0853) in zebrafish larvae at 4 days post-fertilization (dpf) exposed by 4F-MDMB-BINACA for 1 h at 28 °C through direct administration routes via microinjection into the caudal vein (a), heart ventricle (b), and hindbrain (c). The presented sections originated from one representative larva per condition. The images were generated by preparing a colormap from blue (no detection) to yellow (high local concentration), and images were further processed in 96 dpi resolution with 24 bit color under no denoising state. Each panel shows two different slices of the same specimen.