
Image
|
Figure Caption
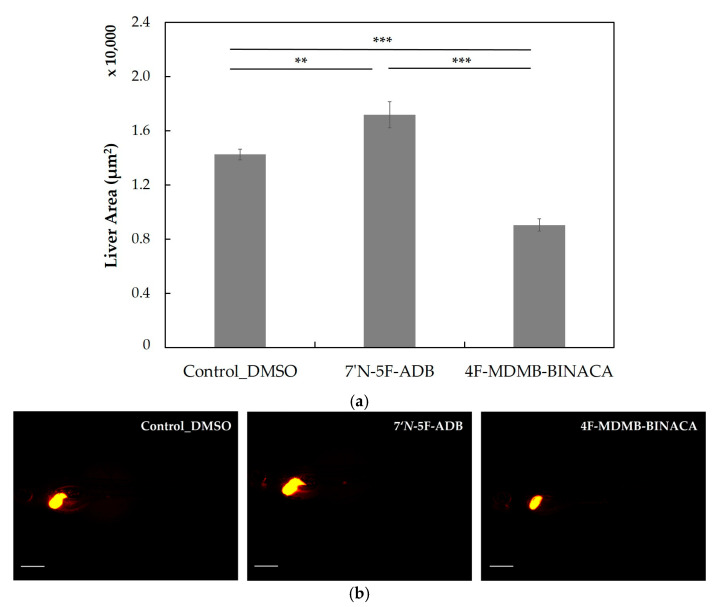
Figure 7
Liver size assessment (a) and red fluorescent liver morphologies (b) of transgenic ZF larvae (Tg(fabp10a:DsRed;elaA:EGFP)) treated by waterborne exposure with DMSO, 7′N-5F-ADB (50 µM), or 4F-MDMB-BINACA (25 µM) from 4 dpf to 5 dpf (n = 11–15). All data are represented by the mean ± standard error of the mean (s.e.m.) and p values were computed by one-way ANOVA (** p < 0.01, *** p < 0.001). Liver sizes were determined based on fluorescence microscopy images using ImageJ 1.53a. Scale bars: 500 µm.
Acknowledgments
This image is the copyrighted work of the attributed author or publisher, and
ZFIN has permission only to display this image to its users.
Additional permissions should be obtained from the applicable author or publisher of the image.
Full text @ Molecules