
Image
|
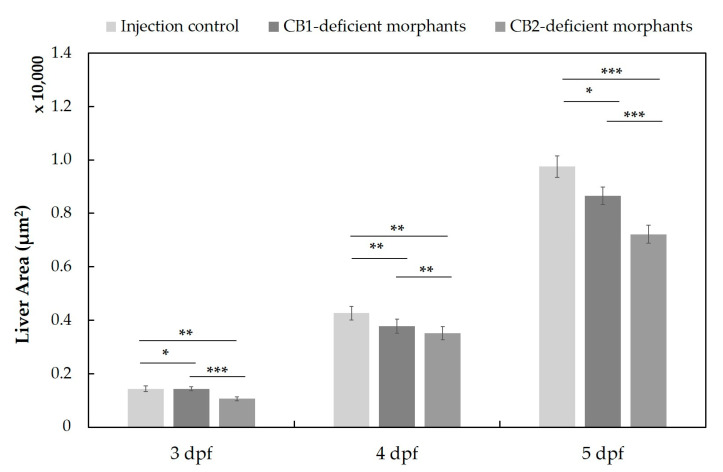
Figure Caption
Figure 8
Liver size assessment in the transgenic ZF line (Tg(fabp10a:DsRed;elaA:EGFP)) after MO injection at one-cell stage to generate CB1- and CB2-deficient morphants (n = 43 (at 3 dpf), 41 (at 4 dpf), 55 (at 5 dpf)). All data are represented by the mean ± standard error of the mean (s.e.m.), and p values were computed with one-way ANOVA (* p < 0.05, ** p < 0.01, *** p < 0.001). Liver sizes were determined based on fluorescence microscopy images using ImageJ 1.53a.
Acknowledgments
This image is the copyrighted work of the attributed author or publisher, and
ZFIN has permission only to display this image to its users.
Additional permissions should be obtained from the applicable author or publisher of the image.
Full text @ Molecules