
- Title
-
Management of Hypercholesterolemia Through Dietary ß-glucans-Insights From a Zebrafish Model
- Authors
- Gora, A.H., Rehman, S., Kiron, V., Dias, J., Fernandes, J.M.O., Olsvik, P.A., Siriyappagouder, P., Vatsos, I., Schmid-Staiger, U., Frick, K., Cardoso, M.
- Source
- Full text @ Front Nutr
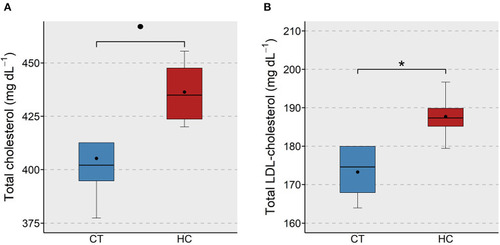
Total and LDL-cholesterol levels in the plasma of zebrafish fed a low or a high cholesterol diet. Boxplots show the total cholesterol |
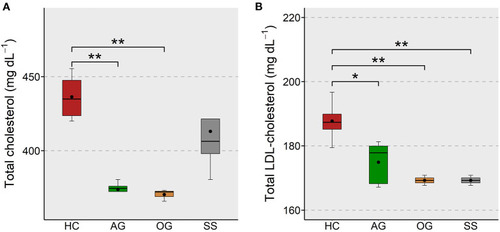
Total and LDL-cholesterol levels in the plasma of zebrafish fed glucans or simvastatin. Boxplots show total cholesterol |
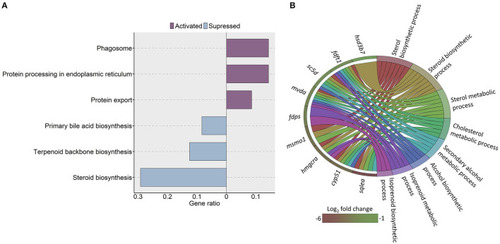
KEGG pathways and GO terms that were enriched in zebrafish fed a high cholesterol diet. |
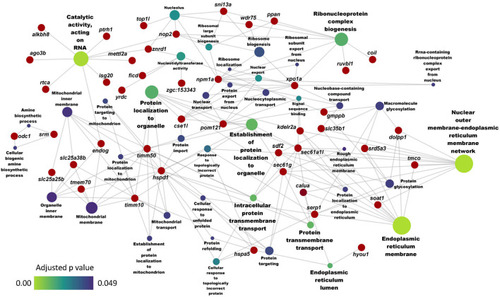
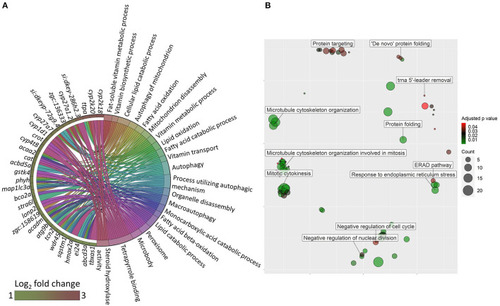
Network showing the link between enriched GO terms and the associated genes that were upregulated in zebrafish fed the high cholesterol (HC) diet compared to the control (CT) diet. Genes that were considered for the enrichment are written near the red circles. The gradient color bar intensity varies with the adjusted |
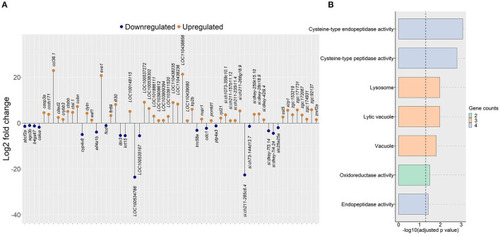
Genes and GO terms that were regulated in zebrafish fed the algal glucan diet. |
GO terms that were altered in zebrafish fed the oat glucan diet. |
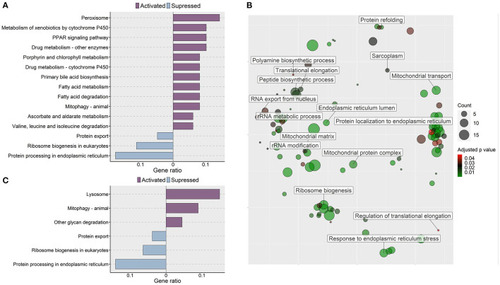
Molecular effects of the oat glucan and simvastatin supplemented diets. (A) KEGG pathways that were altered in zebrafish fed the oat glucan (OG) diet. The enrichment analyses were performed by considering the differentially expressed genes in the OG fed zebrafish compared to the fish fed the high cholesterol (HC) diet. (B) Enriched GO terms in simvastatin fed (SS) group. Only the non-redundant GO terms are marked in the bubble plot, and the analysis was performed using the genes that were downregulated in the SS group compared to the HC group. The color of the circles ranging from green to red indicates the order of adjusted p value. Circle sizes are proportional to the gene number. (C) KEGG pathways that were altered in zebrafish fed simvastatin. The enrichment analyses were performed by considering the differentially expressed genes in the SS group compared to the HC group. Each treatment group consisted of at least five biological replicates. |
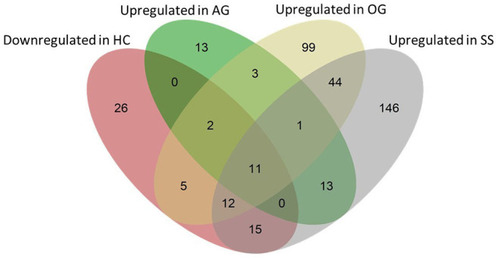
Venn diagram showing the total number of genes that were affected by the experimental diets. The pink ellipse includes the genes that were downregulated in the HC group compared to the CT group. Green, yellow and gray ellipses include genes that were upregulated (compared to the HC group) in the AG, OG and SS groups, respectively. Thirteen (2 + 11), 30 (2 + 5 + 11 + 12) and 38 genes (12 + 15 + 11) that were downregulated in the HC group were upregulated in the AG, OG and SS groups, respectively. |
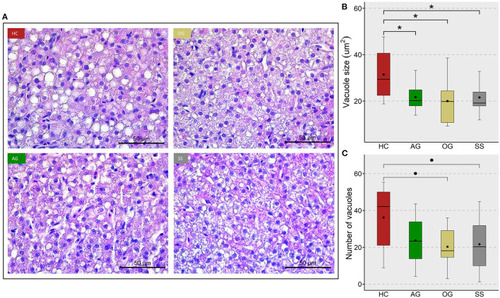
Lipid accumulation in the liver of zebrafish fed four experimental diets. |
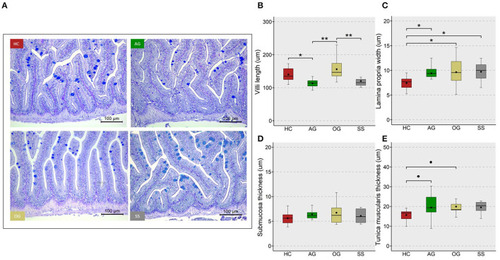
Micromorphology and feature indices of the intestine of the zebrafish. Representative images |

Verification of the expression of selected genes from the transcriptomic data. |