FIGURE

Figure 6

ID
ZDB-FIG-220203-22
Publication
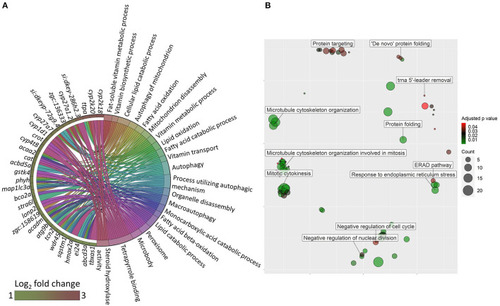
Gora et al., 2022 - Management of Hypercholesterolemia Through Dietary ß-glucans-Insights From a Zebrafish Model
Other Figures
All Figure Page
Back to All Figure Page
Figure 6

GO terms that were altered in zebrafish fed the oat glucan diet. (A) Chord diagram showing the link between enriched GO terms and the associated upregulated genes in the oat glucan (OG) group compared to the high cholesterol diet (HC) group. Genes that were considered for the enrichment are shown on the left half of the circle. The gradient color bar intensity varies with the Log2 fold change. (B) Enriched GO terms in the OG group. Only the non-redundant GO terms are marked in the bubble plot, and the analysis was performed using the genes that were downregulated in the OG group compared to the HC group. The color of the circles ranging from green to red indicates the order of adjusted p value (0.01–0.049). Circle sizes are proportional to the gene count.

Expression Data

Expression Detail
Antibody Labeling
Phenotype Data

Phenotype Detail
Acknowledgments
This image is the copyrighted work of the attributed author or publisher, and ZFIN has permission only to display this image to its users. Additional permissions should be obtained from the applicable author or publisher of the image. Full text @ Front Nutr