
FIGURE
Figure 8
- ID
- ZDB-FIG-220203-13
- Publication
- Gora et al., 2022 - Management of Hypercholesterolemia Through Dietary ß-glucans-Insights From a Zebrafish Model
- Other Figures
- All Figure Page
- Back to All Figure Page
Figure 8
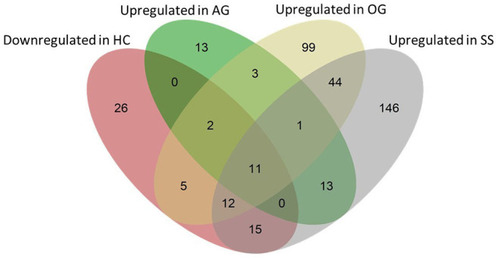
Venn diagram showing the total number of genes that were affected by the experimental diets. The pink ellipse includes the genes that were downregulated in the HC group compared to the CT group. Green, yellow and gray ellipses include genes that were upregulated (compared to the HC group) in the AG, OG and SS groups, respectively. Thirteen (2 + 11), 30 (2 + 5 + 11 + 12) and 38 genes (12 + 15 + 11) that were downregulated in the HC group were upregulated in the AG, OG and SS groups, respectively. |
Expression Data
Expression Detail
Antibody Labeling
Phenotype Data
Phenotype Detail
Acknowledgments
This image is the copyrighted work of the attributed author or publisher, and
ZFIN has permission only to display this image to its users.
Additional permissions should be obtained from the applicable author or publisher of the image.
Full text @ Front Nutr