
Image
|
Figure Caption
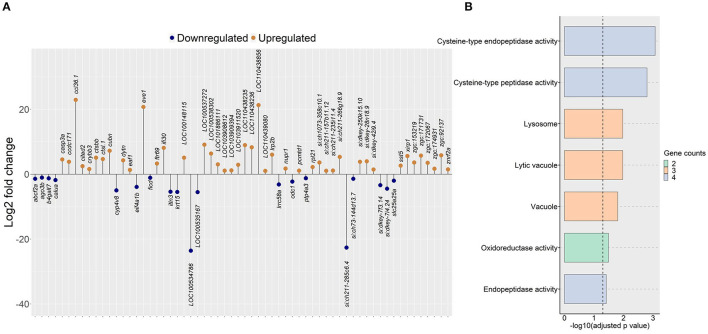
Figure 5
Genes and GO terms that were regulated in zebrafish fed the algal glucan diet.
Acknowledgments
This image is the copyrighted work of the attributed author or publisher, and
ZFIN has permission only to display this image to its users.
Additional permissions should be obtained from the applicable author or publisher of the image.
Full text @ Front Nutr