
FIGURE
Figure 4
- ID
- ZDB-FIG-220203-20
- Publication
- Gora et al., 2022 - Management of Hypercholesterolemia Through Dietary ß-glucans-Insights From a Zebrafish Model
- Other Figures
- All Figure Page
- Back to All Figure Page
Figure 4
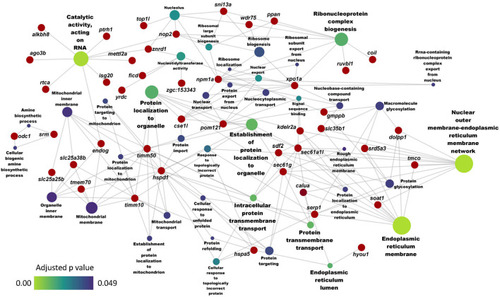
Network showing the link between enriched GO terms and the associated genes that were upregulated in zebrafish fed the high cholesterol (HC) diet compared to the control (CT) diet. Genes that were considered for the enrichment are written near the red circles. The gradient color bar intensity varies with the adjusted |
Expression Data
Expression Detail
Antibody Labeling
Phenotype Data
Phenotype Detail
Acknowledgments
This image is the copyrighted work of the attributed author or publisher, and
ZFIN has permission only to display this image to its users.
Additional permissions should be obtained from the applicable author or publisher of the image.
Full text @ Front Nutr