
FIGURE
Figure 2
- ID
- ZDB-FIG-220203-18
- Publication
- Gora et al., 2022 - Management of Hypercholesterolemia Through Dietary ß-glucans-Insights From a Zebrafish Model
- Other Figures
- All Figure Page
- Back to All Figure Page
Figure 2
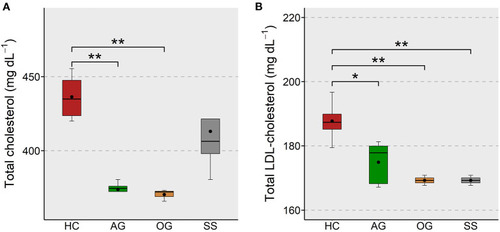
Total and LDL-cholesterol levels in the plasma of zebrafish fed glucans or simvastatin. Boxplots show total cholesterol |
Expression Data
Expression Detail
Antibody Labeling
Phenotype Data
Phenotype Detail
Acknowledgments
This image is the copyrighted work of the attributed author or publisher, and
ZFIN has permission only to display this image to its users.
Additional permissions should be obtained from the applicable author or publisher of the image.
Full text @ Front Nutr