
- Title
-
RNF12 is regulated by AKT phosphorylation and promotes TGF-β driven breast cancer metastasis
- Authors
- Huang, Y., Liu, S., Shan, M., Hagenaars, S.C., Mesker, W.E., Cohen, D., Wang, L., Zheng, Z., Devilee, P., Tollenaar, R.A.E.M., Li, Z., Song, Y., Zhang, L., Li, D., Ten Dijke, P.
- Source
- Full text @ Cell Death Dis.

RNF12 expression in breast and other types of cancer.
A Oncomine box plots of RNF12 mRNA levels in different types of cancer from public datasets (www.oncomine.org). B Statistics of RNF12 protein levels expressed in 499 specimens of different cancer tissues compared with the matched adjacent normal tissues. The two-tailed Student’s t-test was used to determine the statistical significance (*p < 0.05; **p < 0.01; ***p < 0.001; ****p < 0.0001). C Representative images of RNF12 immunohistochemistry result in invasive breast cancer tissues and adjacent normal tissues. The intensity of RNF12 staining is shown in the right-hand panel. Scale bar = 300 μm. D Representative images of RNF12 immunohistochemistry results in lymph node-positive or lymph node-negative breast cancer tissues. The intensity of RNF12 staining in the 175 specimens of breast cancer (ORIGO) is shown in the right-hand panel. E RNF12 correlates with poor prognoses in lymph node-positive breast cancer patients. Kaplan–Meier curves (http://kmplot.com/analysis) show that metastasis-free survival of individuals was negatively correlated with RNF12 expression in lymph node-positive patients (bottom panel) but showed no correlation with RNF12 in lymph node-negative patients (middle panel). |
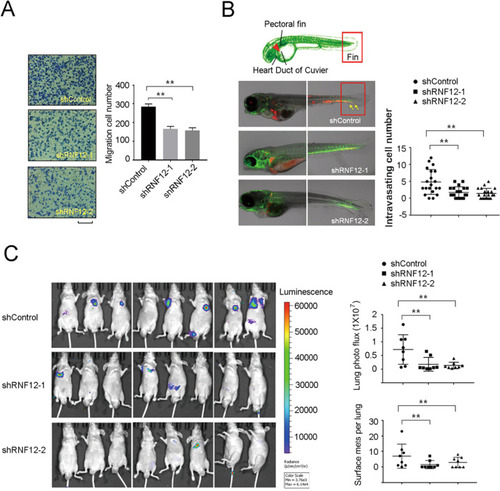
RNF12 increases invasion and metastasis of breast cancer cells.
A Transwell migration of control or RNF12 stably depleted MDA-MB-231 cells. Left panel: Representative images of migrated cells. Right panel, fold changes of migrated cell numbers; mean ± SD of triplicates. Scale bar = 50 μm. B Schematic diagram of the zebrafish embryo; shRNF12 or control MDA-MB-231 cells were injected into the Duc of Cuvier of zebrafish embryos at 48 h post fertilization. Representative images of zebrafish at 5 dpi are shown. Percentage of zebrafish embryos exhibiting invasion at 5 dpi. The results of two independent experiments are shown. The yellow arrows indicate invasive cells. C Depletion of RNF12 inhibits lung metastasis of breast cancer in a transplantable nude mouse model. Left panel: representative bioluminescent images of mice injected with control or RNF12-depleted MDA-MB-231 cells into the tail vein 35 days after injection. Right panel: Bioluminescent signal and surface metastases in the lungs were quantified. Scatter plots are shown as mean ± SD. Statistical significance was set at p < 0.05 (*0.01 < p < 0.05; **0.001 < p < 0.01; ***p < 0.001). |
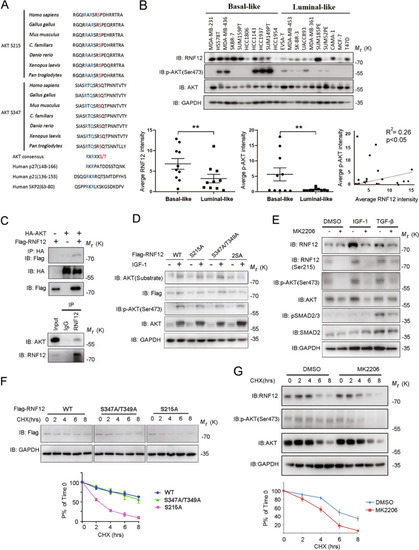
AKT phosphorylates and stabilizes RNF12 protein.
A Sequence alignment of the AKT phosphorylation site within RNF12 orthologues of different species and known AKT substrates, p27, p21, and SKP2 B RNF12 protein was expressed at higher levels in basal-like breast cancer cell lines. Immunoblot analysis of RNF12 and pAKT expression in different breast cancer cell lines; GAPDH was used as the loading control. Scatterplot showing the positive correlation between pAKT and RNF12 expression in breast cancer cell lines (*0.01 < p < 0.05; **0.001 < p < 0.01; ***p < 0.001; Pearson’s coefficient tests were performed to assess significance). C Co-immunoprecipitation of Flag-RNF12 and HA-AKT transfection in HEK293T cells as indicated (left panel). Endogenous interaction between RNF12 and AKT was detected in MDA-MB-231 cells (right panel). Cell lysates were subjected to immunoprecipitation with RNF12 antibody, followed by immunoblotting with an AKT antibody. D AKT phosphorylates RNF12 at Ser215 and 347 in vitro. Flag-RNF12 mutants were transfected into 293T cells, and phosphorylation was detected using a phospho-AKT substrate antibody that recognizes either the RXRXXpS(pT) or the R-KXR-KXXpS(pT) motif. E Immunoblot analysis of whole-cell lysate derived from serum-starved MDA-MB-231 cells treated with IGF-1 (200 ng/mL), TGF-β (5 ng/mL), and MK2206 (5 μM) for 8 h, as indicated. F RNF12 S215A mutant affects protein stability. Top panel: Immunoblot analysis of HEK293T cells were transfected with the indicated plasmids and treated with CHX (20 μg/mL) for the indicated times. Bottom panel: Quantification of RNF12 band intensities. The band intensity was normalized to the time-zero controls. The results are represented by the mean ± SD of three independent sets of experiments. G AKT signaling affects endogenous RNF12 protein stability. Top panel: Immunoblot analysis of MDA-MB-231 cells treated with dimethylsulfoxide (DMSO) or MK2206 (5 μM) together with CHX (20 μg/mL) for the indicated times. Bottom panel: Quantification of RNF12 band intensities. The band intensity was normalized to the time-zero controls. The results are represented by the mean ± SD of three independent sets of experiments. |
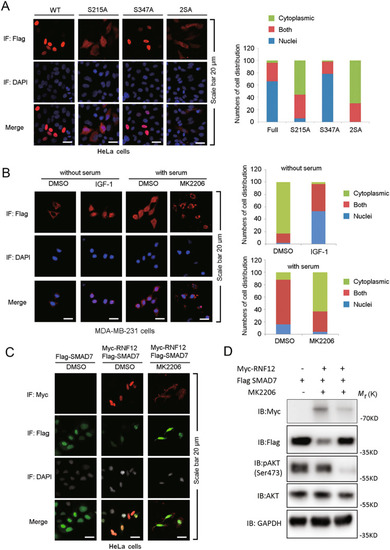
AKT activation promotes the nucleus localization of RNF12.
A Immunofluorescence and 4, 6-diamidino-2-phenylindole (DAPI) staining of HeLa cells stably transfected with RNF12 WT, S215A, S347A/T349A, or S215A/S347A plasmids. Left panel: Number of cells (A) were analyzed according to the following subgroups: cytoplasm, nuclear, or at both locations (both). B Immunofluorescence and DAPI staining of MDA-MB-231 cells treated with IGF-1 (200 ng/mL) and MK2206 (5 μM). C Immunofluorescence and DAPI staining of HeLa cells transfected with Flag-RNF12 and GFP-SMAD7, treated with DMSO or MK2206 (5 μM) for 8 h. D Western blotting experiments relevant with C. |
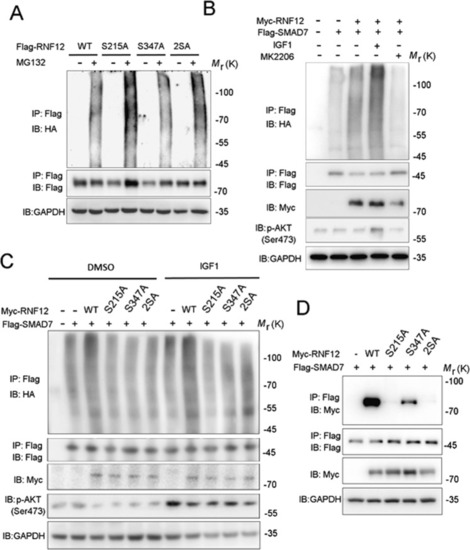
AKT signaling promotes RNF12-mediated SMAD7 ubiquitination.
A Immunoblot analysis of whole-cell lysate and immunoprecipitations derived from HA-Ub-expressing HEK293T cells transfected with Flag-RNF12 WT, RNF12 S215A, or RNF12 S347A/T349A. B AKT signaling regulates RNF12-mediated ubiquitination of SMAD7. Immunoblot analysis of whole-cell lysate and immunoprecipitations derived from HA-Ub-expressing HEK293T cells transfected with Flag-SMAD7 and Myc-RNF12, treated with IGF-1 (200 ng/mL) or MK2206 (5 μM) for 8 h. C RNF12 mutations attenuated ubiquitination of SMAD7 by RNF12. Immunoblot analysis of whole-cell lysates and immunoprecipitation derived from HA-Ub-expressing HEK293T cells transfected with Flag-SMAD7 and Myc-RNF12 mutants. D RNF12 S215A mutation attenuated interaction between RNF12 and SMAD7. HEK293T cells were co-transfected with Flag-SMAD7 and Myc-RNF12 wild-type or mutant plasmids. At 48 h post-transfection, cell lysates were harvested and subjected to anti-FLAG immunoprecipitation followed by anti-Myc western blotting. Protein expression was confirmed by western blotting using total cell lysates. |
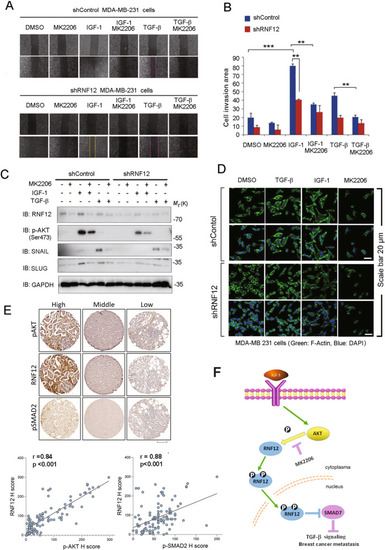
AKT signaling increases TGF-β/RNF12 signaling and related metastasis.
A Control and RNF12 stably depleted MDA-MB-231 cells were plated for the cell wound-healing assay. Sub-confluent MDA-MB-231 cells were wounded using a 20 µL pipette tip and treated with or without the indicated ligands and reagents for 16 h. The wound-healing area at 16 h after wounding was normalized to that at the start time. B Statistical analyses were performed with Student’s t-test (*0.01 < p < 0.05; **0.001 < p < 0.01; ***p < 0.001). For the bar charts, data are plotted as the mean ± SD of at least three independent experiments. C Immunoblotting analysis of mesenchymal marker expression treated with IGF-1, TGF-β, and MK2206 as indicated. D RNF12 depletion inhibits AKT- and TGF-β-induced EMT in MDA-MB 231 cells. Cells were treated with TGF-β for 24 h. F-actin was stained with phalloidin conjugated with tetramethylrhodamine isothiocyanate (TRITC). E Representative images of RNF12 and matched pAKT and pSMAD2 immunohistochemistry results are shown. Graphs in the right panel show the correlation between RNF12 expression levels and those of pSMAD2 in breast cancer TMAs. Spearman’s test was used, and the correlation coefficients and the two-tailed significance values (p < 0.001) are shown. Scale bar = 300 μm. F Proposed model for the crosstalk between AKT signaling and RNF12 in breast cancer metastasis. |