
|
Fig. 1
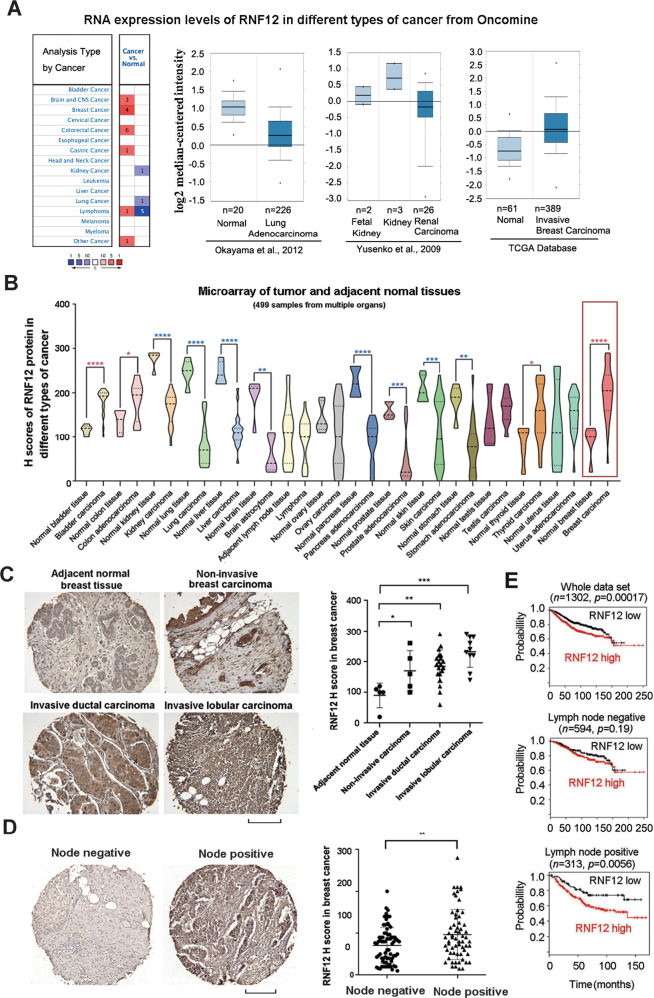
A Oncomine box plots of RNF12 mRNA levels in different types of cancer from public datasets (www.oncomine.org). B Statistics of RNF12 protein levels expressed in 499 specimens of different cancer tissues compared with the matched adjacent normal tissues. The two-tailed Student’s t-test was used to determine the statistical significance (*p < 0.05; **p < 0.01; ***p < 0.001; ****p < 0.0001). C Representative images of RNF12 immunohistochemistry result in invasive breast cancer tissues and adjacent normal tissues. The intensity of RNF12 staining is shown in the right-hand panel. Scale bar = 300 μm. D Representative images of RNF12 immunohistochemistry results in lymph node-positive or lymph node-negative breast cancer tissues. The intensity of RNF12 staining in the 175 specimens of breast cancer (ORIGO) is shown in the right-hand panel. E RNF12 correlates with poor prognoses in lymph node-positive breast cancer patients. Kaplan–Meier curves (http://kmplot.com/analysis) show that metastasis-free survival of individuals was negatively correlated with RNF12 expression in lymph node-positive patients (bottom panel) but showed no correlation with RNF12 in lymph node-negative patients (middle panel).