
|
Fig. 3
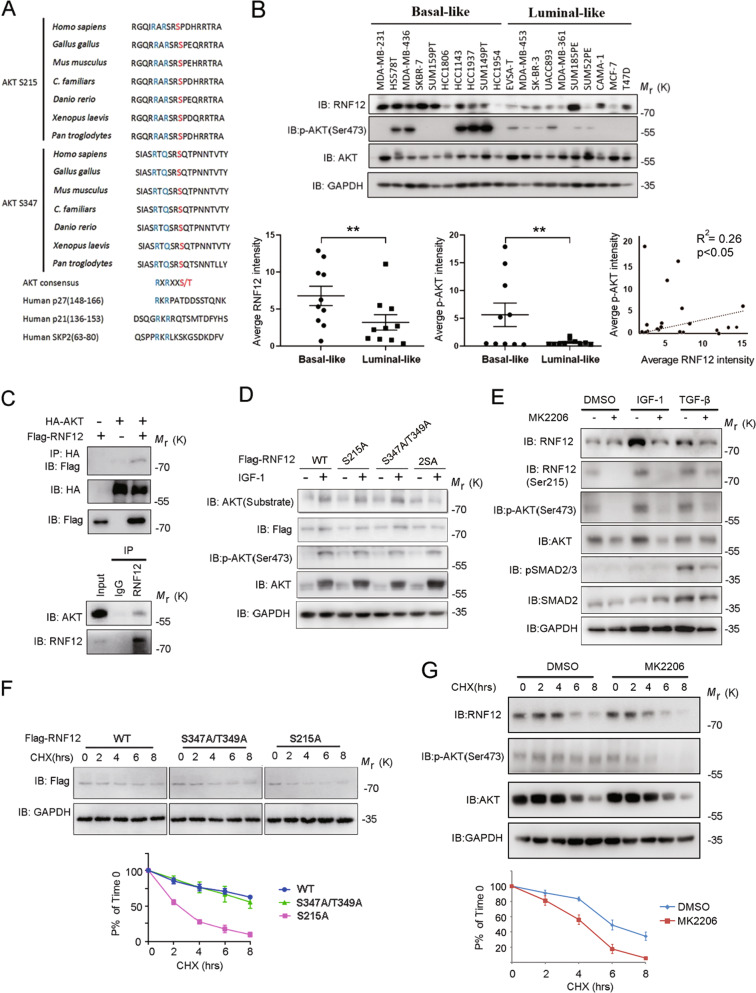
A Sequence alignment of the AKT phosphorylation site within RNF12 orthologues of different species and known AKT substrates, p27, p21, and SKP2 B RNF12 protein was expressed at higher levels in basal-like breast cancer cell lines. Immunoblot analysis of RNF12 and pAKT expression in different breast cancer cell lines; GAPDH was used as the loading control. Scatterplot showing the positive correlation between pAKT and RNF12 expression in breast cancer cell lines (*0.01 < p < 0.05; **0.001 < p < 0.01; ***p < 0.001; Pearson’s coefficient tests were performed to assess significance). C Co-immunoprecipitation of Flag-RNF12 and HA-AKT transfection in HEK293T cells as indicated (left panel). Endogenous interaction between RNF12 and AKT was detected in MDA-MB-231 cells (right panel). Cell lysates were subjected to immunoprecipitation with RNF12 antibody, followed by immunoblotting with an AKT antibody. D AKT phosphorylates RNF12 at Ser215 and 347 in vitro. Flag-RNF12 mutants were transfected into 293T cells, and phosphorylation was detected using a phospho-AKT substrate antibody that recognizes either the RXRXXpS(pT) or the R-KXR-KXXpS(pT) motif. E Immunoblot analysis of whole-cell lysate derived from serum-starved MDA-MB-231 cells treated with IGF-1 (200 ng/mL), TGF-β (5 ng/mL), and MK2206 (5 μM) for 8 h, as indicated. F RNF12 S215A mutant affects protein stability. Top panel: Immunoblot analysis of HEK293T cells were transfected with the indicated plasmids and treated with CHX (20 μg/mL) for the indicated times. Bottom panel: Quantification of RNF12 band intensities. The band intensity was normalized to the time-zero controls. The results are represented by the mean ± SD of three independent sets of experiments. G AKT signaling affects endogenous RNF12 protein stability. Top panel: Immunoblot analysis of MDA-MB-231 cells treated with dimethylsulfoxide (DMSO) or MK2206 (5 μM) together with CHX (20 μg/mL) for the indicated times. Bottom panel: Quantification of RNF12 band intensities. The band intensity was normalized to the time-zero controls. The results are represented by the mean ± SD of three independent sets of experiments.