
- Title
-
Members of the vertebrate contactin and amyloid precursor protein families interact through a conserved interface
- Authors
- Karuppan, S.J., Vogt, A., Fischer, Z., Ladutska, A., Swiastyn, J., McGraw, H.F., Bouyain, S.
- Source
- Full text @ J. Biol. Chem.
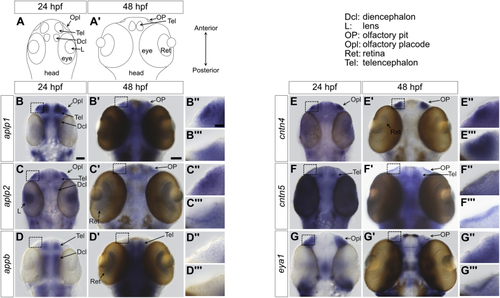
Expression patterns of genes encoding amyloid and CNTN family members in zebrafish embryos.A and A′, cartoons representing the dorsal views of heads from zebrafish embryo at 24 and 48 h post fertilization (hpf). These views are similar to the whole-mount in situ hybridization analyses of amyloid and CNTN family members shown in B–G and B′–G′. B–B''', at 24 hpf, the colorimetric blue signal indicates the presence of aplp1 mRNA in the olfactory placode, telencephalon, and diencephalon. Although more widespread, the colorimetric signal remains in the olfactory placode at 48 hpf. C–C''', at 24 hpf, aplpl2 is expressed in the olfactory placode, eye lens, telencephalon, and diencephalon. The expression remains localized to these general areas at 48 hpf. D–D''', at 24 hpf, appb is expressed mostly in areas of the central nervous system and specifically in the telencephalon and diencephalon. It can also be detected in retinas at 48 hpf. However, no signal is observed in olfactory areas. E–E''', the expression of cntn4 is prevalent in the olfactory placode (24 hpf) and the olfactory pit (48 hpf) although a weak signal can be observed in the retina at 48 hpf. F–F''', cntn5 is found in the olfactory pit (48 hpf) and the telencephalon (24–48 hpf). G–G''', the expression of the gene eya1, which is known to be expressed in the olfactory placode and olfactory pit, is shown for comparison (18). For aplp1, B'' and B''' show detailed views of the olfactory regions denoted by boxes in B and B′, respectively. This panel arrangement is repeated for aplpl2, appb, cntn4, cntn5, and eya1. The scale bar represents 25 μm (24 hpf), 50 μm (48 hpf), and 10 μm in the detailed views of olfactory regions. CNTN, contactin. |
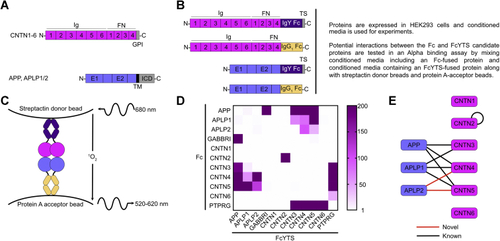
Overview of binding assay to analyze CNTN–amyloid interactions.A, domain organization of CNTNs and amyloid proteins. CNTN1–6 include six immunoglobulin (Ig) domains, four FN domains, and are tethered to the cell membrane by a GPI anchor. APP and its homologs, APLP1 and APLP2, include two globular domains in their extracellular region designed E1 and E2. The E1 domain itself includes two subdomains, a growth factor–like domain followed by a copper-binding domain. The ectodomains of amyloid proteins are followed by single transmembrane helix (TM) followed by an intracellular domain (ICD). B, design of constructs used in the binding assay. The ectodomains of CNTNs and amyloids are fused to the Fc domain of human IgG1 or a protein designated FcYTS that includes (i) the Cν3 and Cν4 domains of chicken IgY and (ii) a Twin-Strep (TS) tag for detection with streptactin. C, in AlphaScreen assays, excitation of donor beads at 680 nm triggers the release of a singlet oxygen. An acceptor bead hit by this highly reactive molecule emits a signal between 520 and 620 nm. Because the half-life of the singlet oxygen is limited, a luminescent signal is only obtained when the donor beads and acceptor beads are within 200 nm. Here, the binding of the FcYTS fusion protein immobilized on donor beads to the Fc fusion protein bound to acceptor beads brings the two beads in proximity. D, results of the binding assay shown in a heat map representation. Raw signals are provided in Fig. S1. The scale indicates the value of the signal for the protein pair protein 1-FcYTS/protein 2-Fc divided by the signal measured for the protein 1-FcYTS/Fc only pair. E, summary of the interactions identified in the extracellular interaction screen. Black and red lines denote known and novel interactions, respectively. The positive controls, GABBRI and PTPRG, have been omitted for clarity. APLP1, amyloid beta precursor like protein 1; APLP2, amyloid beta precursor like protein 2; APP, amyloid precursor protein; CNTN, contactin; FN, fibronectin type III repeat; GABBRI, gamma-aminobutyric acid type B receptor subunit 1; GPI, glycosylphosphatidylinositol; PTPRG, protein tyrosine phosphatase receptor type G. |

Validation of CNTN–amyloid interactions by biolayer interferometry. The E1 domains of APP, APLP1, and APLP2 were biotinylated in a 1:1 M ratio, immobilized onto streptavidin sensors, and titrated against varying concentrations of the FN1–FN3 region of selected CNTN proteins. One representative experiment for each series is shown in A–C, whereas a summary of the affinities measured for at least three biological replicates is shown below each curve. The plots were normalized to the maximal response. APLP1, amyloid beta precursor like protein 1; APLP2, amyloid beta precursor like protein 2; APP, amyloid precursor protein; CNTN, contactin; FN1, first FN repeat; FN3, third FN repeat. |
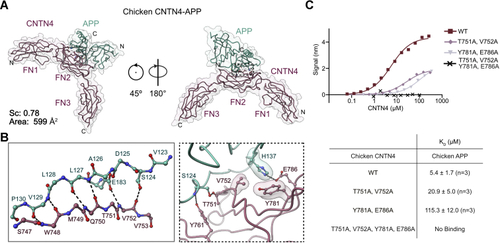
Structural basis for interactions between APP and CNTN4.A, the crystal structure of chicken APP(E1) (green) bound to CNTN4(FN1–FN3) (purple) is shown in a coil representation superimposed with a translucent surface. The letters N and C indicate the N and C termini, respectively. The interface area occludes 599 Å2 of surface area, whereas the shape complementarity (Sc) statistic is consistent with protease–inhibitor complexes (39). B, detailed views of the interfaces boxed in A showing hydrogen bonding interactions between antiparallel β-strands in CNTN4 and APP. Most contacts involve main-chain hydrogen bonding interactions although the side-chain carboxylate group of E183 and the hydroxyl group of S124 form hydrogen bonds with the nitrogen and oxygen atoms of V752 in CNTN4, respectively. Noninteracting side-chain atoms are not shown for clarity. Dashed lines indicate potential hydrogen bonds or salt bridges, whereas translucent surfaces highlight residues involved in packing interactions. C, analysis of the chicken CNTN4–APP interface by site-directed mutagenesis. The biotinylated E1 domain of chicken APP was immobilized onto streptavidin sensors and titrated against varying concentrations of the FN1–FN3 region of chicken CNTN4 proteins. One representative experiment for each series is shown in the top panel, whereas a summary of the affinities measured for at least three biological replicates is shown below the binding curves. APP, amyloid precursor protein; CNTN4, contactin 4; FN1, first FN repeat; FN3, third FN repeat. |

Crystal structures of the mouse CNTN5–APP complex and chicken CNTN3–APP fusion protein.A, the crystal structure of mouse APP(E1) bound to the FN1–FN3 region of mouse CNTN5 is shown in coil representation along with a translucent surface. B, detailed view of side chain–side chain interactions at the CNTN5–APP interface. Dashed lines indicate potential hydrogen bonds or salt bridges, whereas translucent surfaces highlight residues involved in packing interactions. C, main chain–main chain and side chain–main chain hydrogen bonding network, indicated by dashed lines, between antiparallel β-strands in CNTN5 and APP. Side chains not involved in contacts are removed for clarity. In B and C, corresponding residues at the CNTN4–APP interface are superimposed and shown in white. The structures were superimposed using the copper-binding domains of APP (RMSD of 0.46 Å over 69 Cα pairs). D, the crystal structure of the fusion protein between the FN1–FN2 region of chicken CNTN3 fused to the E1 domain of chicken APP is shown in coil and surface representations. E, detailed view of side chain–side chain interactions at the CNTN3–APP interface. Dashed lines indicate potential hydrogen bonds or salt bridges, whereas translucent surfaces highlight residues involved in packing interactions. F, main chain–main chain and side chain–main chain hydrogen bonding network, indicated by dashed lines, between antiparallel β-strands in CNTN3 and APP. Side chains not involved in contacts are removed for clarity. In E and F, corresponding residues at the CNTN4–APP interface are superimposed and shown in white. The structures were superimposed using the copper-binding domains of APP (RMSD of 0.25 Å over 69 Cα pairs). APP, amyloid precursor protein; CNTN3, contactin 3; CNTN5, contactin 5; FN1, first FN repeat; FN2, second FN repeat; FN3, third FN repeat. |

Crystal structures of zebrafish CNTN4 bound to APPb and APLP2.A, crystal structure of the copper-binding domain of zebrafish APPb in complex with CNTN4(FN1–FN3). B, crystal structure of the fusion protein between zebrafish CNTN4(FN1–FN2) and the E1 domain of APLP2. In A and B, the structures are shown in coil and surface representations, whereas the letters N and C indicate the N and C termini, respectively. C, detailed view of side chain–side chain interactions at the CNTN4–APPb and CNTN4–APLP2 interfaces. Dashed lines indicate potential hydrogen bonds or salt bridges, whereas translucent surfaces highlight residues involved in packing interactions. D, main-chain hydrogen bonding network, indicated by dashed lines, between antiparallel β-strands in CNTN4 and APPb–APLP2. The structures were superimposed using the copper-binding domains of APPb and APLP2 (RMSD of 0.57 Å over 62 Cα pairs). APLP2, amyloid beta precursor like protein 2; APP, amyloid precursor protein; CNTN4, contactin 4; FN1, first FN repeat; FN2, second FN repeat; FN3, third FN repeat. |
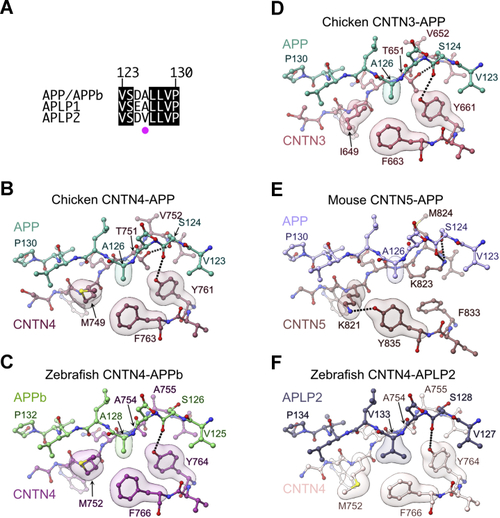
Distinct contacts at CNTN–amyloid interfaces.A, sequence alignment of APP/APPb, APLP1, and APLP2. In the limited segments shown here, the sequences of human, mouse, chicken APP, and zebrafish APPb are identical. Similarly, the sequences of human, mouse, and zebrafish APLP1 are identical, and the sequences of human, mouse, chicken, and zebrafish APLP2 are identical. Strictly conserved residues are shown in black. The magenta dot indicates the position of A126, which is conserved in APP and APLP1, but replaced by a valine in APLP2. The numbering above the sequences corresponds to amino acid positions in chicken APP, which is identical in mouse and human APP. A more extensive alignment is shown in Fig. S2. B, detailed view of the chicken CNTN4–APP interface with translucent surfaces highlighting APP residue A126 nestled against M749, Y761, and Y763 in CNTN4. Dashed lines indicate hydrogen bonds between T751, Y761, and S124. C, detailed view of the zebrafish CNTN4–APPb interface highlighting interactions between APPb residue A128 and CNTN4 residues M752, Y764, and F766. Note that compared with the chicken sequence, the sequence of chicken CNTN4 is offset by three amino acids. D, detailed view of the chicken CNTN3–APP interface. Here, A126 contacts I649, Y661, and F663. Dashed lines indicate hydrogen bonds between T651, Y661, and APP residue S124. E, detailed view of the mouse CNTN5–APP interface. Here, APP residue A126 contacts the aliphatic portion of K821 and Y835 but not F833. Dashed lines indicate hydrogen bonds between K821 and Y835 in CNTN5 and between K823 in CNTN5 and S124 in APP. F, detailed view of the zebrafish CNTN4–APLP2 interface. The alanine residue found in APP is replaced by a valine in APLP2 (V133), which contacts M752, Y764, and F766. The side chain of M752 has swung away from the position it occupies in the chicken CNTN4–APP and zebrafish CNTN4–APPb complexes. APLP2, amyloid beta precursor like protein 2; APP, amyloid precursor protein; CNTN, contactin. |

Binding specificity in CNTN–amyloid interactions.A, sequence alignments of mouse CNTN1–6 for a subset of residues at the CNTN–amyloid interface. Identical residues are shown in black. Magenta dots indicate the positions of amino acids that are mutated in mouse CNTN4 in the experiments shown in B–E. B–E, analysis of CNTN4–APP interactions by BLI following mutations at the CNTN4–APP interface. In all experiments, the biotinylated E1 domain of mouse APP or its A126V variant was immobilized onto streptavidin sensors and titrated against varying concentrations of the FN1–FN3 region of mouse CNTN4 proteins. One representative experiment for each experimental series is shown in B–E. F, summary of affinities measured for three biological replicates for each set of proteins. APP, amyloid precursor protein; BLI, biolayer interferometry; CNTN, contactin; FN1, first FN repeat; FN3, third FN repeat. |

A model illustrating how a CNTN–amyloid complex would mediate interactions with receptors expressed on specific target cells.A, CNTN3–5 form cis complexes on axonal surfaces as well as the surfaces of target cells. The flexibility of the linker regions between the E1 and the E2 domains of APP, APLP1, and APLP2 makes it possible to bind to the second FN domain of CNTNs on the same cell or on an apposing cell. Alternatively, a CNTN–amyloid pair on axons could interact with an as of yet unknown partner on the target surface (B). APLP1, amyloid beta precursor like protein 1; APLP2, amyloid beta precursor like protein 2; APP, amyloid precursor protein; CNTN, contactin; FN, fibronectin type III repeat. |