
- Title
-
Interacting Effects of Cell Size and Temperature on Gene Expression, Growth, Development and Swimming Performance in Larval Zebrafish
- Authors
- van de Pol, I.L.E., Hermaniuk, A., Verberk, W.C.E.P.
- Source
- Full text @ Front. Physiol.
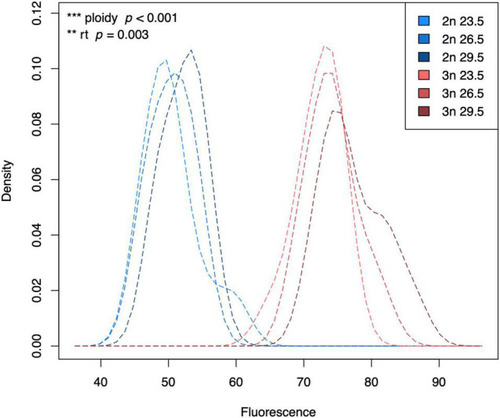
Kernel density plot of the fluorescence of G1 phase cells of diploid and triploid larvae reared at different temperatures. Light, medium, and dark blue lines represent densities for diploid larvae reared at 23.5°C, 26.5°C, and 29.5°C, respectively. Light, medium, and dark red lines represent densities for triploid larvae reared at 23.5°C, 26.5°C, and 29.5°C, respectively. The density is scaled to 1 (100%), which does not have a unit. Fluorescence also does not have a unit, which is why we always add a standard when measuring fluorescence of our samples. Effects of rearing temperature and ploidy were significant (ANOVA, p = 0.003 and ANOVA, p < 0.001, respectively, n = 63). |

G2/G1 ratio of diploid and triploid larvae reared at different temperatures. The ratio of cells in the G1 and G2 phase was calculated as G2/G1*100 for each larva. The box extends from the lower quartile to the upper quartile of the data, spanning the inter-quartile range (IQR). The thick line within the box represents the median. Whiskers extend to minima and maxima, but are limited to data points 1.5 times outside the IQR. The asterisk represents an outlier. The effect of ploidy and the interaction between ploidy level and rearing temperature were significant (ANOVA, p < 0.001, n = 64). |
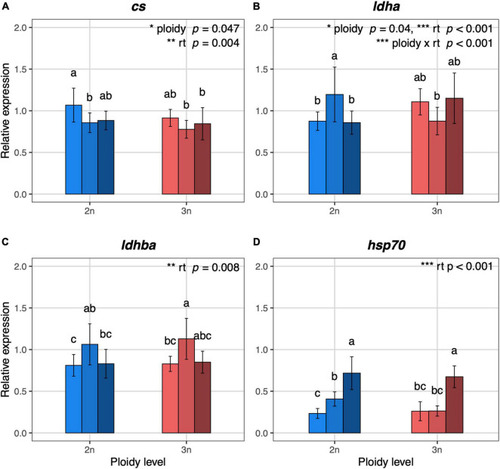
Relative expression values of metabolism and temperature related genes in 5 dpf diploid and triploid larvae reared at different temperatures. (A) cs, citrate synthase, mitochondrial. (B) ldha, L-lactate dehydrogenase A chain. (C) ldhba, L-lactate dehydrogenase B-A chain. (D) hsp70.1, heat shock cognate 70-kd protein, tandem duplicate 1. Light, medium, and dark blue bars represent expression values for diploid larvae reared at 23.5°C, 26.5°C, and 29.5°C, respectively. Light, medium, and dark red bars represent expression values for triploid larvae reared at 23.5°C, 26.5°C, and 29.5°C, respectively. For each gene, the expression values are normalized using a combined index of the relative quantity of the six housekeeping genes shown in Supplementary Figure 5. Values are represented as means with standard deviations. Rearing temperature and ploidy were significant for cs (ANOVA, p = 0.004 and p = 0.047, respectively, n = 48). The interaction between rearing temperature and ploidy, rearing temperature and ploidy were significant for ldha (ANOVA, p < 0.001, p = 0.001, and p = 0.04, respectively, n = 48). Rearing temperature was significant for ldhba and hsp70.1 (ANOVA, p = 0.008 and p < 0.001, respectively, n = 48; n = 47 for hsp70.1). Different letters indicate significant differences between groups (Tukey’s post hoc test, p < 0.05, n = 48). |
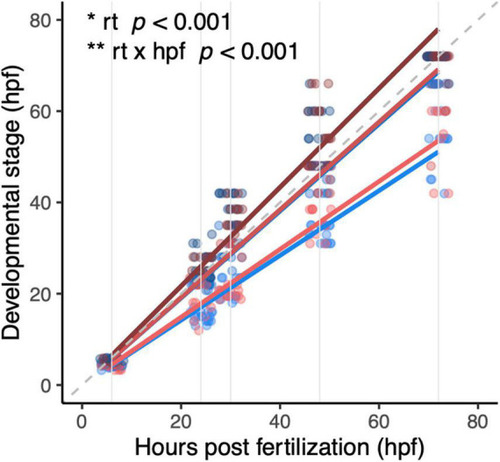
Development of diploid and triploid larvae up to 72 hpf reared at different temperatures. Light, medium, and dark blue lines represent development of diploid larvae reared at 23.5°C, 26.5°C, and 29.5°C, respectively. Light, medium, and dark red lines represent development of triploid larvae reared at 23.5°C, 26.5°C, and 29.5°C, respectively. Note that at 26.5°C and 29.5°C the red and blue lines almost entirely overlap. In this graph, the dashed gray line is the reference x = y. Solid gray lines are the hours post-fertilization at which the embryos and larvae were staged, namely: 6, 24, 30, 48, and 72 h. Effects of rearing temperature and the interaction between hpf and rearing temperature were significant (ANOVA, p < 0.001, n = 393). |
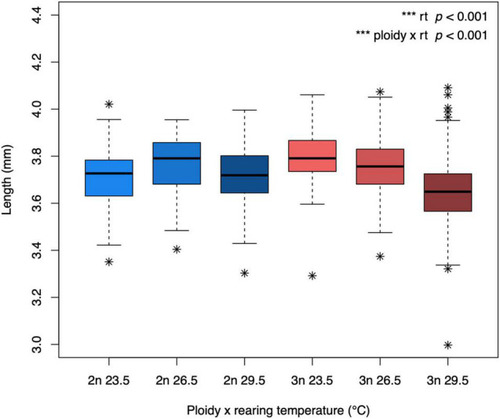
Body length of diploid and triploid larvae reared at different temperatures. Body length was determined at the developmental stage of 5 dpf. The box extends from the lower quartile to the upper quartile of the data, spanning the inter-quartile range (IQR). The thick line within the box represents the median. Whiskers extend to minima and maxima, but are limited to data points 1.5 times outside the IQR. The asterisks represent outliers. The effect of rearing temperature and the interaction between rearing temperature and ploidy level were significant (ANOVA, p < 0.001, n = 565). |
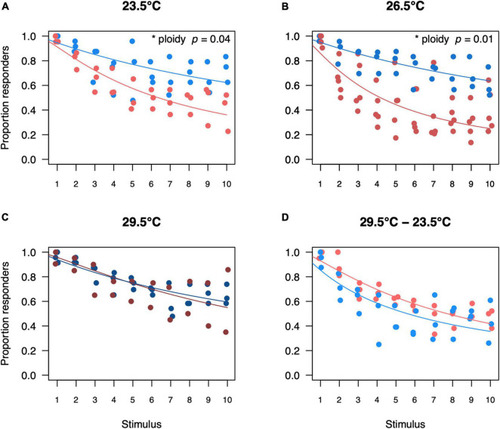
Proportion of diploid and triploid responders for each startle stimulus per temperature treatment. Proportion of responders for diploid and triploid larvae reared and measured at 23.5°C (A), 26.5°C (B), 29.5°C (C) or reared at 29.5°C and measured at 23.5°C (D). Depicted values are the proportion of responders per trial, where blue points represent diploid larvae and red points represent triploid larvae. Over all the effect of stimulus number was significant (ANOVA, p < 0.001, n = 250) as was the interaction between ploidy level and stimulus number (ANOVA, p < 0.05, n = 250). The effect of ploidy was also analyzed for a subset of each temperature treatment, comparing a model with and without ploidy level included. Ploidy was significant for larvae reared and measured at 23.5°C (ANOVA, p = 0.04, n = 60) and for larvae reared and measured at 26.5°C (ANOVA, p = 0.01, n = 80). Ploidy was not significant for larvae reared and measured at 29.5°C (ANOVA, p = 0.87, n = 50) and for larvae reared at 29.5°C and measured at 23.5°C (ANOVA, p = 0.06, n = 60). |
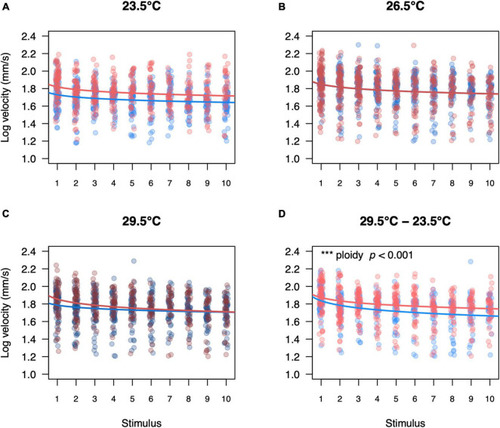
Swimming velocity of diploid and triploid responders for each startle stimulus per temperature treatment. Swimming velocity of diploid and triploid larvae reared and measured at 23.5°C (A), 26.5°C (B), 29.5°C (C) or reared at 29.5°C and measured at 23.5°C (D). Each value represents an individual larva that responded to the startle stimulus, where blue points represent diploid larvae and red points represent triploid larvae. Over all the effects of ploidy level (ANOVA, p < 0.05), temperature treatment (ANOVA, p < 0.05), stimulus number (ANOVA, p < 0.001), and length (ANOVA, p < 0.001) were significant. The effect of ploidy was also analyzed for a subset of each temperature treatment, comparing a model with and without ploidy level included. Ploidy was significant for larvae reared at 29.5°C and measured at 23.5°C (p < 0.001, n = 60). |