
|
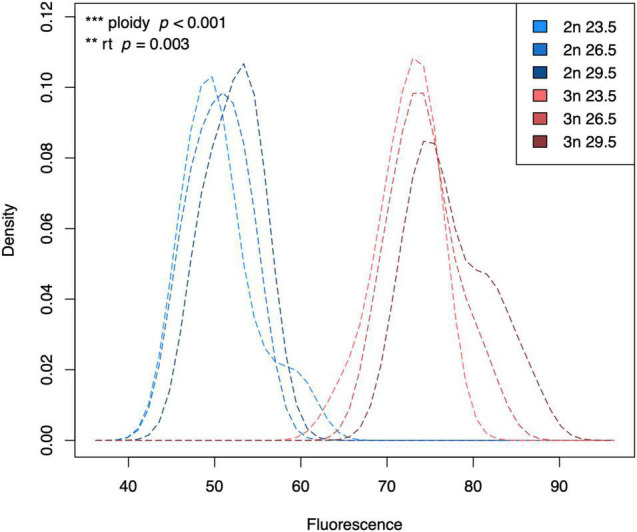
FIGURE 1 Kernel density plot of the fluorescence of G1 phase cells of diploid and triploid larvae reared at different temperatures. Light, medium, and dark blue lines represent densities for diploid larvae reared at 23.5°C, 26.5°C, and 29.5°C, respectively. Light, medium, and dark red lines represent densities for triploid larvae reared at 23.5°C, 26.5°C, and 29.5°C, respectively. The density is scaled to 1 (100%), which does not have a unit. Fluorescence also does not have a unit, which is why we always add a standard when measuring fluorescence of our samples. Effects of rearing temperature and ploidy were significant (ANOVA, p = 0.003 and ANOVA, p < 0.001, respectively, n = 63).