
FIGURE 3
- ID
- ZDB-FIG-220104-47
- Publication
- van de Pol et al., 2021 - Interacting Effects of Cell Size and Temperature on Gene Expression, Growth, Development and Swimming Performance in Larval Zebrafish
- Other Figures
- All Figure Page
- Back to All Figure Page
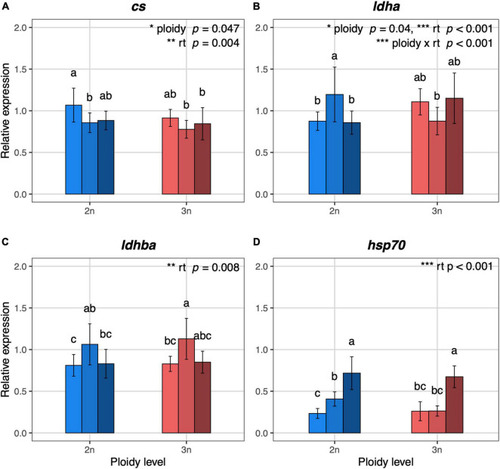
Relative expression values of metabolism and temperature related genes in 5 dpf diploid and triploid larvae reared at different temperatures. (A) cs, citrate synthase, mitochondrial. (B) ldha, L-lactate dehydrogenase A chain. (C) ldhba, L-lactate dehydrogenase B-A chain. (D) hsp70.1, heat shock cognate 70-kd protein, tandem duplicate 1. Light, medium, and dark blue bars represent expression values for diploid larvae reared at 23.5°C, 26.5°C, and 29.5°C, respectively. Light, medium, and dark red bars represent expression values for triploid larvae reared at 23.5°C, 26.5°C, and 29.5°C, respectively. For each gene, the expression values are normalized using a combined index of the relative quantity of the six housekeeping genes shown in Supplementary Figure 5. Values are represented as means with standard deviations. Rearing temperature and ploidy were significant for cs (ANOVA, p = 0.004 and p = 0.047, respectively, n = 48). The interaction between rearing temperature and ploidy, rearing temperature and ploidy were significant for ldha (ANOVA, p < 0.001, p = 0.001, and p = 0.04, respectively, n = 48). Rearing temperature was significant for ldhba and hsp70.1 (ANOVA, p = 0.008 and p < 0.001, respectively, n = 48; n = 47 for hsp70.1). Different letters indicate significant differences between groups (Tukey’s post hoc test, p < 0.05, n = 48). |