
Image
|
Figure Caption
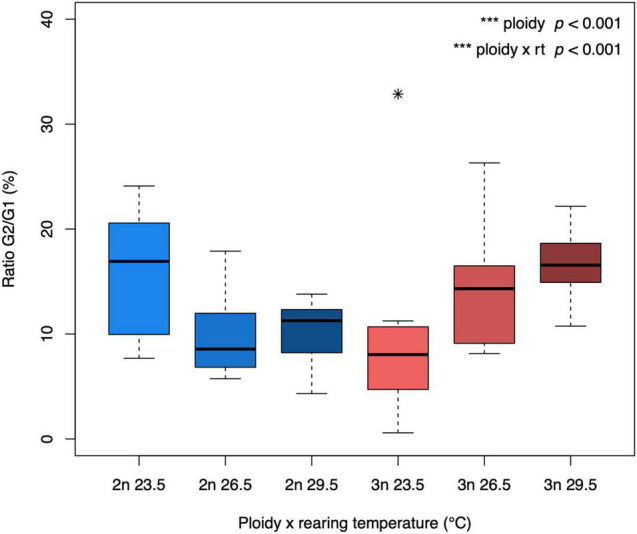
FIGURE 2 G2/G1 ratio of diploid and triploid larvae reared at different temperatures. The ratio of cells in the G1 and G2 phase was calculated as G2/G1*100 for each larva. The box extends from the lower quartile to the upper quartile of the data, spanning the inter-quartile range (IQR). The thick line within the box represents the median. Whiskers extend to minima and maxima, but are limited to data points 1.5 times outside the IQR. The asterisk represents an outlier. The effect of ploidy and the interaction between ploidy level and rearing temperature were significant (ANOVA, p < 0.001, n = 64).
Acknowledgments
This image is the copyrighted work of the attributed author or publisher, and
ZFIN has permission only to display this image to its users.
Additional permissions should be obtained from the applicable author or publisher of the image.
Full text @ Front. Physiol.